|
Download Data (XLS File) |
|
||||||||
|
||||||||
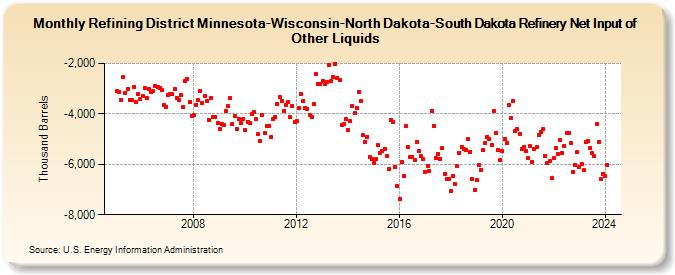
| Refining District Minnesota-Wisconsin-North Dakota-South Dakota Refinery Net Input of Other Liquids (Thousand Barrels) | ||||||||
| Year | Jan | Feb | Mar | Apr | May | Jun | Jul | Aug | Sep | Oct | Nov | Dec |
|---|---|---|---|---|---|---|---|---|---|---|---|---|
| 2005 | -3,110 | -3,114 | -3,463 | -2,528 | -3,183 | -3,016 | -3,439 | -3,468 | -2,915 | -3,524 | -3,194 | -3,426 |
| 2006 | -3,300 | -2,981 | -3,363 | -3,018 | -3,150 | -3,110 | -2,884 | -2,937 | -2,990 | -3,069 | -3,659 | -3,719 |
| 2007 | -3,250 | -3,198 | -3,225 | -3,018 | -3,358 | -3,446 | -3,262 | -3,717 | -2,682 | -2,600 | -3,518 | -4,081 |
| 2008 | -4,046 | -3,648 | -3,433 | -3,088 | -3,570 | -3,292 | -3,506 | -4,226 | -3,350 | -4,129 | -4,131 | -4,363 |
| 2009 | -4,607 | -4,383 | -4,452 | -3,882 | -3,703 | -3,365 | -4,387 | -4,091 | -4,591 | -4,199 | -4,367 | -4,183 |
| 2010 | -4,647 | -4,309 | -4,374 | -4,006 | -3,944 | -4,201 | -4,800 | -5,070 | -4,051 | -4,747 | -4,477 | -4,467 |
| 2011 | -4,933 | -4,201 | -4,125 | -3,593 | -3,322 | -3,478 | -3,868 | -3,647 | -3,515 | -4,133 | -3,673 | -4,333 |
| 2012 | -4,271 | -3,782 | -3,212 | -3,486 | -3,756 | -3,798 | -4,041 | -4,131 | -3,602 | -2,426 | -2,819 | -2,830 |
| 2013 | -2,691 | -2,808 | -2,726 | -2,063 | -2,710 | -2,555 | -2,003 | -2,563 | -2,650 | -4,438 | -4,399 | -4,215 |
| 2014 | -4,632 | -4,298 | -3,680 | -3,972 | -3,758 | -3,142 | -3,500 | -4,849 | -5,101 | -4,899 | -5,711 | -5,795 |
| 2015 | -5,947 | -5,808 | -5,236 | -5,546 | -5,489 | -5,399 | -5,661 | -6,177 | -4,236 | -4,333 | -6,108 | -6,861 |
| 2016 | -7,387 | -5,896 | -6,462 | -4,496 | -5,324 | -5,710 | -5,715 | -5,812 | -5,096 | -5,465 | -5,684 | -5,792 |
| 2017 | -6,311 | -6,052 | -6,256 | -3,895 | -4,478 | -5,741 | -5,577 | -5,773 | -5,373 | -6,390 | -6,593 | -6,576 |
| 2018 | -7,052 | -6,453 | -6,780 | -6,081 | -5,538 | -5,299 | -5,393 | -5,423 | -4,982 | -5,504 | -6,602 | -7,029 |
| 2019 | -6,615 | -6,037 | -6,207 | -5,433 | -5,164 | -4,921 | -4,988 | -5,241 | -3,891 | -4,775 | -5,417 | -5,812 |
| 2020 | -5,473 | -4,979 | -5,144 | -3,660 | -4,150 | -3,488 | -4,679 | -4,616 | -4,786 | -5,406 | -5,305 | -5,475 |
| 2021 | -5,766 | -5,285 | -5,897 | -5,405 | -5,316 | -4,827 | -4,724 | -4,615 | -5,659 | -5,933 | -5,881 | -6,544 |
| 2022 | -5,739 | -5,346 | -5,587 | -5,038 | -5,552 | -5,264 | -4,749 | -4,739 | -5,165 | -6,295 | -6,011 | -5,519 |
| 2023 | -6,112 | -5,999 | -6,231 | -5,098 | -5,084 | -5,357 | -5,570 | -5,677 | -4,403 | -5,133 | -6,595 | -6,369 |
| 2024 | -6,452 | |||||||||||
| - = No Data Reported; -- = Not Applicable; NA = Not Available; W = Withheld to avoid disclosure of individual company data. |
| Release Date: 3/29/2024 |
| Next Release Date: 4/30/2024 |