|
Download Data (XLS File) |
|
||||||||
|
||||||||
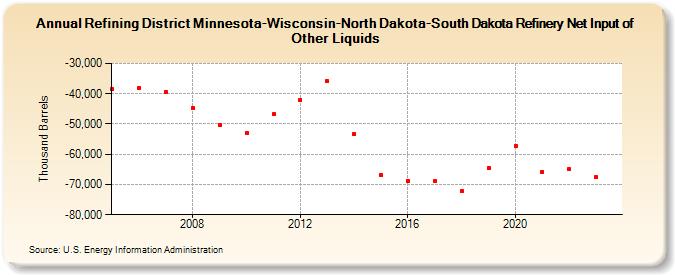
| Refining District Minnesota-Wisconsin-North Dakota-South Dakota Refinery Net Input of Other Liquids (Thousand Barrels) | ||||||||
| Decade | Year-0 | Year-1 | Year-2 | Year-3 | Year-4 | Year-5 | Year-6 | Year-7 | Year-8 | Year-9 |
|---|---|---|---|---|---|---|---|---|---|---|
| 2000's | -38,380 | -38,180 | -39,355 | -44,782 | -50,210 | |||||
| 2010's | -53,093 | -46,821 | -42,154 | -35,821 | -53,337 | -66,801 | -68,839 | -69,015 | -72,136 | -64,501 |
| 2020's | -57,161 | -65,852 | -65,004 | -67,628 |
| - = No Data Reported; -- = Not Applicable; NA = Not Available; W = Withheld to avoid disclosure of individual company data. |
| Release Date: 8/30/2024 |
| Next Release Date: 8/29/2025 |