|
Download Data (XLS File) |
|
||||||||
|
||||||||
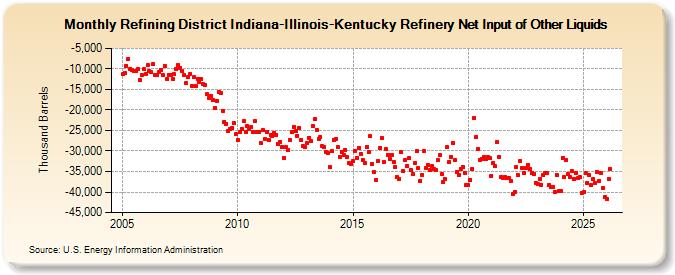
| Refining District Indiana-Illinois-Kentucky Refinery Net Input of Other Liquids (Thousand Barrels) | ||||||||
| Year | Jan | Feb | Mar | Apr | May | Jun | Jul | Aug | Sep | Oct | Nov | Dec |
|---|---|---|---|---|---|---|---|---|---|---|---|---|
| 2005 | -11,310 | -11,009 | -9,200 | -7,581 | -9,946 | -10,315 | -10,414 | -10,461 | -10,005 | -12,606 | -11,515 | -10,050 |
| 2006 | -11,220 | -9,168 | -10,492 | -10,846 | -8,909 | -11,545 | -11,546 | -10,636 | -10,199 | -11,527 | -9,210 | -12,477 |
| 2007 | -11,465 | -11,560 | -12,576 | -11,322 | -10,007 | -9,098 | -9,727 | -10,529 | -11,589 | -13,536 | -12,068 | -11,129 |
| 2008 | -14,147 | -12,034 | -14,123 | -12,502 | -13,071 | -12,403 | -13,721 | -13,914 | -16,212 | -17,046 | -16,616 | -17,679 |
| 2009 | -19,499 | -17,708 | -15,670 | -15,973 | -20,188 | -22,899 | -23,389 | -25,155 | -24,664 | -24,430 | -23,288 | -25,935 |
| 2010 | -27,242 | -25,313 | -24,531 | -22,749 | -25,394 | -23,949 | -24,566 | -24,086 | -25,291 | -22,709 | -25,384 | -25,391 |
| 2011 | -27,930 | -24,925 | -27,103 | -25,413 | -27,247 | -26,051 | -26,445 | -25,522 | -26,030 | -28,310 | -27,706 | -29,066 |
| 2012 | -31,589 | -29,143 | -29,653 | -27,308 | -25,412 | -24,082 | -25,030 | -26,269 | -24,301 | -27,388 | -28,904 | -29,028 |
| 2013 | -28,045 | -26,733 | -27,637 | -23,869 | -22,280 | -24,811 | -26,995 | -26,524 | -28,892 | -29,053 | -30,336 | -30,559 |
| 2014 | -33,897 | -29,931 | -27,203 | -26,961 | -29,067 | -31,456 | -30,162 | -31,023 | -29,661 | -31,429 | -32,932 | -33,287 |
| 2015 | -32,462 | -29,984 | -31,630 | -29,171 | -30,717 | -32,098 | -32,988 | -29,028 | -30,303 | -26,445 | -33,200 | -35,216 |
| 2016 | -37,026 | -32,490 | -29,234 | -26,824 | -32,681 | -29,571 | -30,914 | -31,894 | -30,939 | -32,569 | -33,890 | -36,432 |
| 2017 | -36,830 | -30,329 | -34,832 | -32,267 | -33,680 | -31,739 | -34,576 | -35,574 | -32,984 | -30,093 | -34,049 | -37,284 |
| 2018 | -35,762 | -30,036 | -34,110 | -33,468 | -34,639 | -33,773 | -34,421 | -34,670 | -32,259 | -31,035 | -35,696 | -37,552 |
| 2019 | -36,869 | -29,116 | -32,726 | -31,479 | -28,081 | -32,228 | -35,033 | -35,821 | -34,285 | -33,832 | -35,359 | -38,364 |
| 2020 | -38,356 | -36,997 | -34,408 | -21,946 | -26,555 | -29,446 | -32,108 | -31,876 | -31,409 | -32,051 | -31,409 | -31,816 |
| 2021 | -35,984 | -32,876 | -33,774 | -27,821 | -31,401 | -36,231 | -36,598 | -36,365 | -36,543 | -36,523 | -37,197 | -40,481 |
| 2022 | -39,891 | -33,932 | -35,913 | -32,363 | -34,175 | -35,351 | -34,101 | -33,368 | -34,402 | -35,245 | -35,497 | -37,683 |
| 2023 | -38,047 | -36,943 | -38,175 | -35,940 | -35,241 | -35,466 | -38,206 | -38,745 | -38,679 | -39,953 | -35,831 | -39,730 |
| 2024 | -39,984 | |||||||||||
| - = No Data Reported; -- = Not Applicable; NA = Not Available; W = Withheld to avoid disclosure of individual company data. |
| Release Date: 3/29/2024 |
| Next Release Date: 4/30/2024 |