|
Download Data (XLS File) |
|
||||||||
|
||||||||
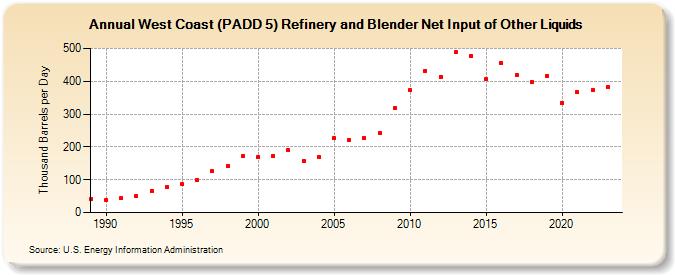
| West Coast (PADD 5) Refinery and Blender Net Input of Other Liquids (Thousand Barrels per Day) | ||||||||
| Decade | Year-0 | Year-1 | Year-2 | Year-3 | Year-4 | Year-5 | Year-6 | Year-7 | Year-8 | Year-9 |
|---|---|---|---|---|---|---|---|---|---|---|
| 1980's | 42 | |||||||||
| 1990's | 38 | 44 | 49 | 66 | 78 | 86 | 100 | 126 | 142 | 171 |
| 2000's | 170 | 172 | 190 | 158 | 169 | 227 | 222 | 227 | 243 | 318 |
| 2010's | 372 | 432 | 414 | 488 | 478 | 406 | 455 | 420 | 397 | 417 |
| 2020's | 335 | 366 | 374 | 383 |
| - = No Data Reported; -- = Not Applicable; NA = Not Available; W = Withheld to avoid disclosure of individual company data. |
| Release Date: 4/30/2024 |
| Next Release Date: 8/30/2024 |