|
Download Data (XLS File) |
|
||||||||
|
||||||||
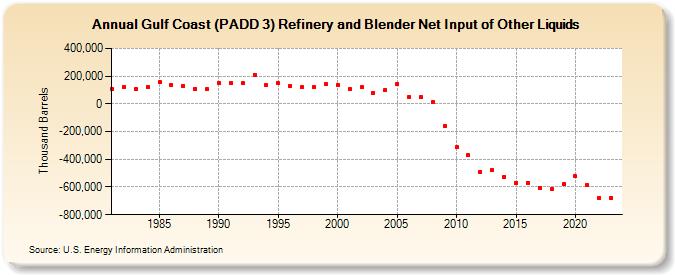
| Gulf Coast (PADD 3) Refinery and Blender Net Input of Other Liquids (Thousand Barrels) | ||||||||
| Decade | Year-0 | Year-1 | Year-2 | Year-3 | Year-4 | Year-5 | Year-6 | Year-7 | Year-8 | Year-9 |
|---|---|---|---|---|---|---|---|---|---|---|
| 1980's | 107,005 | 121,340 | 105,764 | 122,303 | 156,497 | 136,124 | 129,325 | 110,285 | 106,985 | |
| 1990's | 149,213 | 152,468 | 149,132 | 210,884 | 133,129 | 147,279 | 128,669 | 118,266 | 120,627 | 140,640 |
| 2000's | 138,692 | 104,108 | 118,528 | 81,103 | 99,391 | 143,906 | 49,992 | 46,522 | 9,718 | -162,216 |
| 2010's | -313,678 | -372,732 | -491,904 | -476,850 | -525,376 | -567,969 | -569,799 | -603,901 | -611,361 | -581,186 |
| 2020's | -522,915 | -586,322 | -677,053 | -680,122 |
| - = No Data Reported; -- = Not Applicable; NA = Not Available; W = Withheld to avoid disclosure of individual company data. |
| Release Date: 3/29/2024 |
| Next Release Date: 8/30/2024 |