|
Download Data (XLS File) |
|
||||||||
|
||||||||
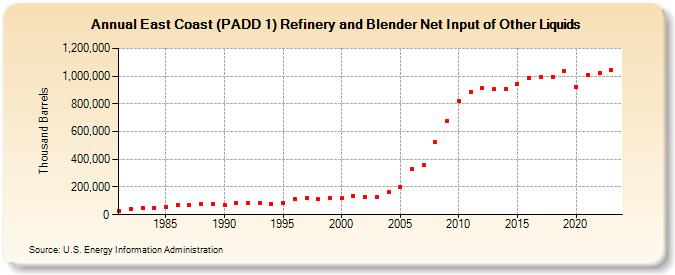
| East Coast (PADD 1) Refinery and Blender Net Input of Other Liquids (Thousand Barrels) | ||||||||
| Decade | Year-0 | Year-1 | Year-2 | Year-3 | Year-4 | Year-5 | Year-6 | Year-7 | Year-8 | Year-9 |
|---|---|---|---|---|---|---|---|---|---|---|
| 1980's | 29,859 | 41,176 | 51,162 | 50,357 | 54,076 | 67,786 | 71,822 | 80,467 | 78,834 | |
| 1990's | 71,363 | 86,685 | 86,384 | 84,515 | 74,313 | 83,966 | 110,409 | 121,292 | 109,972 | 122,898 |
| 2000's | 117,223 | 136,219 | 128,997 | 125,244 | 163,484 | 197,742 | 326,944 | 355,593 | 521,976 | 678,613 |
| 2010's | 819,189 | 888,069 | 916,830 | 905,358 | 909,935 | 946,278 | 989,328 | 991,022 | 996,737 | 1,040,071 |
| 2020's | 919,944 | 1,009,506 | 1,024,188 | 1,047,350 |
| - = No Data Reported; -- = Not Applicable; NA = Not Available; W = Withheld to avoid disclosure of individual company data. |
| Release Date: 3/29/2024 |
| Next Release Date: 8/30/2024 |