|
Download Data (XLS File) |
|
||||||||
|
||||||||
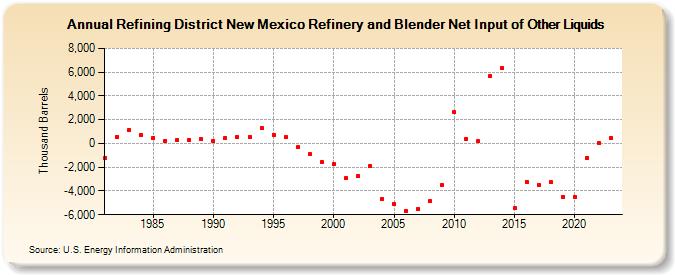
| Refining District New Mexico Refinery and Blender Net Input of Other Liquids (Thousand Barrels) | ||||||||
| Decade | Year-0 | Year-1 | Year-2 | Year-3 | Year-4 | Year-5 | Year-6 | Year-7 | Year-8 | Year-9 |
|---|---|---|---|---|---|---|---|---|---|---|
| 1980's | -1,221 | 572 | 1,125 | 716 | 495 | 238 | 272 | 274 | 334 | |
| 1990's | 204 | 465 | 517 | 546 | 1,337 | 734 | 524 | -318 | -915 | -1,573 |
| 2000's | -1,770 | -2,935 | -2,726 | -1,911 | -4,657 | -5,071 | -5,698 | -5,524 | -4,883 | -3,540 |
| 2010's | 2,604 | 382 | 182 | 5,676 | 6,329 | -5,467 | -3,205 | -3,478 | -3,247 | -4,487 |
| 2020's | -4,494 | -1,231 | 36 | 444 |
| - = No Data Reported; -- = Not Applicable; NA = Not Available; W = Withheld to avoid disclosure of individual company data. |
| Release Date: 3/29/2024 |
| Next Release Date: 8/30/2024 |