|
Download Data (XLS File) |
|
||||||||
|
||||||||
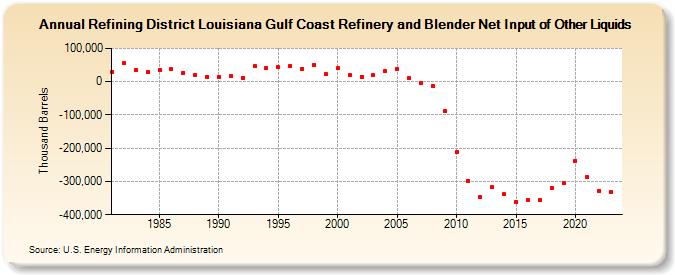
| Refining District Louisiana Gulf Coast Refinery and Blender Net Input of Other Liquids (Thousand Barrels) | ||||||||
| Decade | Year-0 | Year-1 | Year-2 | Year-3 | Year-4 | Year-5 | Year-6 | Year-7 | Year-8 | Year-9 |
|---|---|---|---|---|---|---|---|---|---|---|
| 1980's | 30,171 | 54,743 | 34,143 | 28,781 | 36,036 | 37,036 | 27,412 | 20,927 | 14,918 | |
| 1990's | 15,479 | 16,382 | 11,250 | 46,184 | 40,530 | 43,211 | 46,143 | 38,050 | 51,565 | 21,639 |
| 2000's | 39,647 | 19,109 | 15,348 | 18,821 | 32,308 | 36,803 | 9,596 | -2,935 | -12,391 | -89,329 |
| 2010's | -212,545 | -298,975 | -347,215 | -317,950 | -338,587 | -361,210 | -356,526 | -356,367 | -319,323 | -305,693 |
| 2020's | -237,556 | -287,687 | -327,344 | -332,021 |
| - = No Data Reported; -- = Not Applicable; NA = Not Available; W = Withheld to avoid disclosure of individual company data. |
| Release Date: 3/29/2024 |
| Next Release Date: 8/30/2024 |