|
Download Data (XLS File) |
|
||||||||
|
||||||||
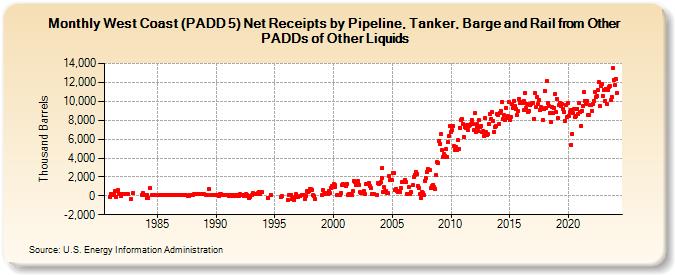
| West Coast (PADD 5) Net Receipts by Pipeline, Tanker, Barge and Rail from Other PADDs of Other Liquids (Thousand Barrels) | ||||||||
| Year | Jan | Feb | Mar | Apr | May | Jun | Jul | Aug | Sep | Oct | Nov | Dec |
|---|---|---|---|---|---|---|---|---|---|---|---|---|
| 1981 | -87 | 160 | 116 | 207 | 539 | -146 | 489 | 578 | 143 | 190 | 4 | |
| 1982 | 210 | 167 | 181 | 190 | -356 | 346 | ||||||
| 1983 | 133 | 288 | 89 | |||||||||
| 1984 | 102 | -258 | 82 | -232 | 844 | 119 | 54 | 102 | ||||
| 1985 | 72 | 57 | 124 | 50 | 70 | 104 | ||||||
| 1986 | 65 | 82 | 94 | 101 | 113 | 82 | 92 | 117 | ||||
| 1987 | 117 | 120 | 91 | 70 | 8 | 22 | 108 | 106 | ||||
| 1988 | 109 | 205 | 210 | 156 | 140 | 154 | ||||||
| 1989 | 145 | 118 | 91 | 680 | 96 | 114 | 96 | 112 | ||||
| 1990 | 101 | 109 | -37 | 164 | 204 | 100 | 106 | 109 | ||||
| 1991 | 91 | 0 | 0 | 127 | 0 | 91 | 0 | 0 | 107 | 98 | 0 | 0 |
| 1992 | 139 | 126 | 33 | 70 | 112 | 25 | 100 | 203 | 70 | 0 | -235 | -162 |
| 1993 | 42 | 247 | 196 | 250 | 382 | 218 | 388 | |||||
| 1994 | -208 | 103 | ||||||||||
| 1995 | -147 | -60 | ||||||||||
| 1996 | -393 | 116 | 63 | 89 | -294 | -406 | -117 | 146 | ||||
| 1997 | -117 | -59 | 102 | 59 | -382 | 19 | 535 | 450 | 545 | |||
| 1998 | 734 | 678 | 646 | 42 | -18 | -367 | ||||||
| 1999 | 46 | 600 | 199 | 187 | 256 | 225 | 230 | 556 | 254 | 850 | 1,013 | 1,011 |
| 2000 | 1,229 | 894 | 1,136 | 107 | 100 | 298 | 1,120 | 1,203 | 1,119 | |||
| 2001 | 1,171 | 1,001 | 1,231 | 128 | 142 | 141 | 47 | 459 | 1,519 | 1,422 | 1,148 | |
| 2002 | 1,430 | 1,530 | 1,177 | 399 | 291 | 273 | 469 | 183 | 1,249 | 1,288 | 1,260 | |
| 2003 | 1,349 | 1,061 | 813 | 200 | 160 | 171 | 121 | 1,349 | 1,283 | 1,358 | ||
| 2004 | 1,412 | 1,936 | 2,982 | 453 | 883 | 517 | 495 | 287 | 256 | 2,060 | 1,666 | 1,640 |
| 2005 | 1,632 | 2,442 | 2,376 | 655 | 717 | 464 | 352 | 490 | 383 | 803 | 1,431 | 1,418 |
| 2006 | 1,481 | 1,694 | 1,468 | 190 | 195 | 896 | 214 | 405 | 1,105 | 2,035 | 2,248 | |
| 2007 | 2,546 | 2,338 | 1,072 | 781 | 165 | -251 | 376 | 320 | 75 | 1,598 | 1,923 | 2,494 |
| 2008 | 2,860 | 2,748 | 2,731 | 780 | 1,023 | 1,162 | 937 | 707 | 2,150 | 3,545 | 3,484 | |
| 2009 | 5,844 | 5,530 | 6,525 | 4,799 | 4,154 | 4,406 | 4,223 | 4,945 | 4,070 | 5,690 | 6,329 | 7,351 |
| 2010 | 6,744 | 6,911 | 7,383 | 5,233 | 4,830 | 5,126 | 4,894 | 5,869 | 4,966 | 7,213 | 7,976 | 8,164 |
| 2011 | 7,591 | 6,230 | 7,247 | 7,147 | 7,453 | 6,973 | 7,361 | 7,539 | 7,556 | 8,072 | 7,553 | 6,914 |
| 2012 | 8,733 | 6,775 | 7,585 | 7,275 | 6,844 | 7,978 | 7,270 | 7,402 | 6,756 | 6,908 | 6,328 | 8,182 |
| 2013 | 6,711 | 6,405 | 6,520 | 7,642 | 8,708 | 8,154 | 8,841 | 7,874 | 6,780 | 7,236 | 7,432 | 8,673 |
| 2014 | 8,597 | 7,618 | 8,763 | 9,001 | 9,944 | 8,093 | 8,521 | 7,973 | 9,333 | 8,260 | 8,486 | 9,904 |
| 2015 | 7,989 | 8,342 | 9,749 | 9,334 | 10,030 | 9,554 | 9,231 | 8,584 | 9,001 | 10,256 | 9,808 | 9,768 |
| 2016 | 9,935 | 9,838 | 10,019 | 9,097 | 10,903 | 9,249 | 9,733 | 8,863 | 8,962 | 9,573 | 9,681 | 9,805 |
| 2017 | 9,824 | 8,147 | 10,866 | 9,424 | 10,468 | 9,729 | 10,173 | 9,026 | 9,402 | 9,258 | 8,008 | 9,153 |
| 2018 | 11,088 | 9,260 | 12,141 | 9,864 | 9,496 | 8,803 | 7,802 | 9,424 | 8,782 | 9,342 | 10,735 | 8,886 |
| 2019 | 10,288 | 8,200 | 9,575 | 9,871 | 9,464 | 9,700 | 9,235 | 8,915 | 7,929 | 9,633 | 8,293 | 9,870 |
| 2020 | 8,484 | 8,867 | 9,127 | 5,405 | 6,573 | 8,710 | 9,202 | 8,311 | 8,467 | 9,234 | 8,633 | 9,805 |
| 2021 | 8,829 | 7,401 | 9,010 | 9,502 | 10,960 | 10,080 | 9,764 | 10,023 | 8,568 | 8,555 | 9,559 | 9,601 |
| 2022 | 8,989 | 9,751 | 10,078 | 10,943 | 10,495 | 10,580 | 11,192 | 12,031 | 9,458 | 11,628 | 11,805 | 10,597 |
| 2023 | 11,163 | 10,083 | 11,333 | 9,744 | 11,173 | 11,490 | 11,669 | 10,107 | 10,470 | 13,497 | 12,304 | 11,706 |
| 2024 | 12,391 | |||||||||||
| - = No Data Reported; -- = Not Applicable; NA = Not Available; W = Withheld to avoid disclosure of individual company data. |
| Release Date: 3/29/2024 |
| Next Release Date: 4/30/2024 |