|
Download Data (XLS File) |
|
||||||||
|
||||||||
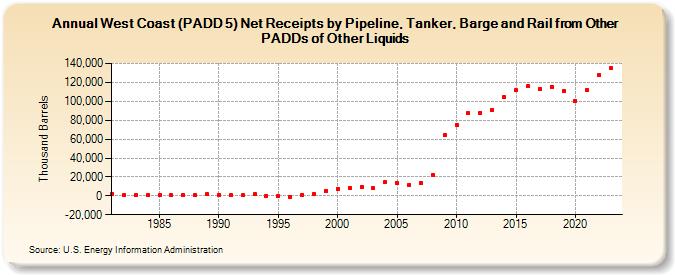
| West Coast (PADD 5) Net Receipts by Pipeline, Tanker, Barge and Rail from Other PADDs of Other Liquids (Thousand Barrels) | ||||||||
| Decade | Year-0 | Year-1 | Year-2 | Year-3 | Year-4 | Year-5 | Year-6 | Year-7 | Year-8 | Year-9 |
|---|---|---|---|---|---|---|---|---|---|---|
| 1980's | 2,193 | 738 | 510 | 813 | 477 | 746 | 642 | 974 | 1,452 | |
| 1990's | 856 | 514 | 481 | 1,723 | -105 | -207 | -796 | 1,152 | 1,715 | 5,427 |
| 2000's | 7,206 | 8,409 | 9,549 | 7,865 | 14,587 | 13,163 | 11,931 | 13,437 | 22,127 | 63,865 |
| 2010's | 75,308 | 87,637 | 88,034 | 90,977 | 104,494 | 111,644 | 115,659 | 113,478 | 115,625 | 110,974 |
| 2020's | 100,815 | 111,852 | 127,547 | 134,738 |
| - = No Data Reported; -- = Not Applicable; NA = Not Available; W = Withheld to avoid disclosure of individual company data. |
| Release Date: 3/29/2024 |
| Next Release Date: 8/30/2024 |