|
Download Data (XLS File) |
|
||||||||
|
||||||||
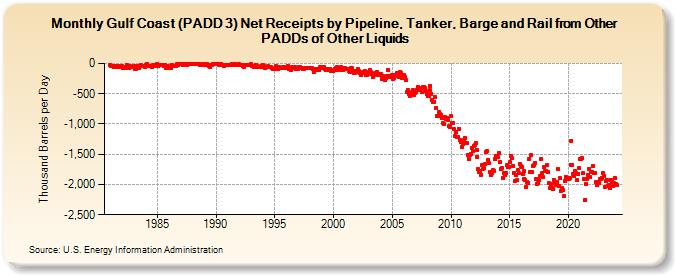
| Gulf Coast (PADD 3) Net Receipts by Pipeline, Tanker, Barge and Rail from Other PADDs of Other Liquids (Thousand Barrels per Day) | ||||||||
| Year | Jan | Feb | Mar | Apr | May | Jun | Jul | Aug | Sep | Oct | Nov | Dec |
|---|---|---|---|---|---|---|---|---|---|---|---|---|
| 1981 | -20 | -46 | -37 | -37 | -64 | -45 | -44 | -54 | -47 | -45 | -56 | -54 |
| 1982 | -38 | -69 | -82 | -66 | -67 | -32 | -45 | -68 | -34 | -54 | -57 | -59 |
| 1983 | -36 | -91 | -93 | -39 | -59 | -72 | -40 | -30 | -36 | -43 | -40 | -54 |
| 1984 | -26 | -8 | -26 | -48 | -40 | -35 | -34 | -57 | -31 | -40 | -38 | -23 |
| 1985 | -10 | -37 | -23 | -20 | -29 | -24 | -27 | -40 | -17 | -77 | -81 | -46 |
| 1986 | -67 | -65 | -71 | -32 | -35 | -34 | -35 | -39 | -14 | -24 | -15 | -9 |
| 1987 | -1 | -11 | -24 | -1 | -10 | -11 | -25 | -7 | -14 | -16 | -15 | -7 |
| 1988 | -12 | -8 | -16 | -3 | -14 | -4 | -13 | -4 | -22 | -23 | -27 | -4 |
| 1989 | -23 | -13 | -22 | -11 | -17 | -47 | -54 | -32 | -24 | -13 | -5 | -9 |
| 1990 | -12 | -7 | -11 | -27 | -18 | -10 | -17 | -17 | -38 | -21 | -26 | -20 |
| 1991 | -17 | -22 | -20 | -27 | -10 | -31 | -31 | -16 | -28 | -27 | -31 | -16 |
| 1992 | -23 | -24 | -28 | -32 | -35 | -56 | -24 | -19 | -24 | -23 | -21 | -23 |
| 1993 | -16 | -35 | -49 | -59 | -55 | -24 | -49 | -52 | -62 | -58 | -47 | -56 |
| 1994 | -28 | -42 | -72 | -56 | -62 | -49 | -62 | -64 | -63 | -79 | -83 | -85 |
| 1995 | -87 | -46 | -77 | -86 | -57 | -69 | -72 | -72 | -63 | -51 | -62 | -68 |
| 1996 | -56 | -39 | -80 | -87 | -74 | -107 | -53 | -78 | -59 | -66 | -85 | -75 |
| 1997 | -83 | -64 | -60 | -79 | -80 | -91 | -83 | -82 | -80 | -82 | -68 | -79 |
| 1998 | -73 | -70 | -80 | -85 | -148 | -84 | -96 | -104 | -97 | -104 | -64 | -72 |
| 1999 | -65 | -74 | -64 | -87 | -101 | -99 | -104 | -101 | -93 | -122 | -117 | -119 |
| 2000 | -112 | -89 | -109 | -77 | -66 | -100 | -88 | -70 | -61 | -104 | -108 | -81 |
| 2001 | -76 | -90 | -97 | -88 | -124 | -141 | -77 | -82 | -122 | -153 | -153 | -127 |
| 2002 | -141 | -97 | -130 | -150 | -187 | -158 | -140 | -148 | -131 | -191 | -187 | -179 |
| 2003 | -144 | -110 | -146 | -181 | -217 | -198 | -162 | -165 | -135 | -194 | -175 | -184 |
| 2004 | -180 | -211 | -262 | -207 | -257 | -269 | -244 | -203 | -111 | -213 | -220 | -208 |
| 2005 | -195 | -249 | -240 | -193 | -206 | -155 | -210 | -225 | -135 | -152 | -233 | -196 |
| 2006 | -188 | -221 | -274 | -469 | -438 | -501 | -537 | -524 | -470 | -443 | -521 | -489 |
| 2007 | -468 | -435 | -385 | -414 | -406 | -438 | -474 | -396 | -394 | -406 | -458 | -506 |
| 2008 | -539 | -541 | -446 | -367 | -502 | -596 | -640 | -632 | -556 | -742 | -867 | -862 |
| 2009 | -802 | -840 | -855 | -899 | -991 | -994 | -886 | -926 | -902 | -930 | -1,037 | -1,047 |
| 2010 | -873 | -987 | -978 | -1,082 | -1,193 | -1,127 | -1,213 | -1,209 | -1,081 | -1,269 | -1,303 | -1,374 |
| 2011 | -1,334 | -1,271 | -1,228 | -1,320 | -1,322 | -1,509 | -1,579 | -1,507 | -1,495 | -1,392 | -1,455 | -1,359 |
| 2012 | -1,351 | -1,318 | -1,422 | -1,552 | -1,741 | -1,792 | -1,771 | -1,837 | -1,683 | -1,738 | -1,728 | -1,663 |
| 2013 | -1,456 | -1,452 | -1,594 | -1,650 | -1,799 | -1,840 | -1,816 | -1,765 | -1,770 | -1,583 | -1,523 | -1,531 |
| 2014 | -1,548 | -1,481 | -1,636 | -1,739 | -1,732 | -1,890 | -1,803 | -1,850 | -1,816 | -1,685 | -1,709 | -1,719 |
| 2015 | -1,634 | -1,537 | -1,563 | -1,701 | -1,804 | -1,946 | -1,840 | -1,931 | -1,764 | -1,811 | -1,668 | -1,688 |
| 2016 | -1,719 | -1,826 | -1,785 | -1,902 | -1,923 | -2,044 | -1,957 | -1,969 | -1,574 | -1,792 | -1,517 | -1,795 |
| 2017 | -1,700 | -1,684 | -1,640 | -1,906 | -1,999 | -1,970 | -1,932 | -1,864 | -1,578 | -1,809 | -1,879 | -1,718 |
| 2018 | -1,776 | -1,776 | -1,673 | -1,801 | -1,976 | -2,064 | -1,995 | -2,058 | -2,069 | -1,922 | -1,978 | -2,007 |
| 2019 | -1,967 | -1,743 | -2,022 | -1,894 | -2,113 | -2,059 | -2,098 | -2,198 | -1,935 | -1,872 | -1,888 | -1,892 |
| 2020 | -1,912 | -1,897 | -1,681 | -1,281 | -1,675 | -1,821 | -1,857 | -1,778 | -1,808 | -1,931 | -1,822 | -1,729 |
| 2021 | -1,571 | -1,571 | -1,567 | -1,815 | -1,916 | -2,249 | -1,988 | -1,904 | -1,844 | -1,740 | -1,874 | -1,797 |
| 2022 | -1,791 | -1,689 | -1,817 | -1,815 | -1,964 | -2,014 | -1,966 | -1,974 | -1,915 | -1,916 | -1,886 | -1,817 |
| 2023 | -1,866 | -2,035 | -1,940 | -1,923 | -2,019 | -2,003 | -2,065 | -1,923 | -1,984 | -1,987 | -1,970 | -1,887 |
| 2024 | -1,990 | -1,994 | -1,901 | -1,999 | -2,049 | -2,009 | ||||||
| - = No Data Reported; -- = Not Applicable; NA = Not Available; W = Withheld to avoid disclosure of individual company data. |
| Release Date: 8/30/2024 |
| Next Release Date: 9/30/2024 |