|
Download Data (XLS File) |
|
||||||||
|
||||||||
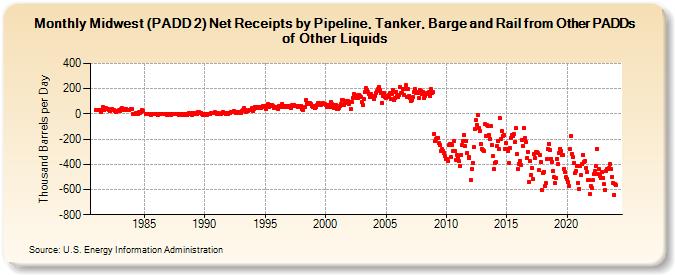
| Midwest (PADD 2) Net Receipts by Pipeline, Tanker, Barge and Rail from Other PADDs of Other Liquids (Thousand Barrels per Day) | ||||||||
| Year | Jan | Feb | Mar | Apr | May | Jun | Jul | Aug | Sep | Oct | Nov | Dec |
|---|---|---|---|---|---|---|---|---|---|---|---|---|
| 1981 | 28 | 33 | 30 | 30 | 34 | 15 | 27 | 51 | 27 | 43 | 44 | 37 |
| 1982 | 37 | 30 | 24 | 30 | 36 | 32 | 30 | 25 | 17 | 25 | 25 | 32 |
| 1983 | 26 | 38 | 45 | 36 | 33 | 34 | 40 | 31 | 30 | 27 | 42 | 39 |
| 1984 | 3 | 6 | 3 | 1 | 13 | 11 | 12 | 27 | 24 | |||
| 1985 | 1 | -3 | -4 | 3 | -4 | -7 | 1 | 0 | 0 | 1 | ||
| 1986 | -11 | -3 | -3 | -2 | -2 | -1 | -2 | -3 | -4 | -6 | -2 | |
| 1987 | -4 | -4 | -5 | -1 | -2 | -2 | -1 | -2 | -2 | -1 | -5 | -3 |
| 1988 | -1 | -3 | -6 | -2 | -5 | -3 | -5 | -2 | 11 | 10 | 8 | -5 |
| 1989 | 9 | 3 | 4 | -3 | -2 | 12 | 18 | 9 | 9 | 1 | -5 | -3 |
| 1990 | 0 | -4 | -8 | 1 | 0 | 0 | 5 | 9 | 5 | 11 | 13 | 8 |
| 1991 | -1 | 7 | 2 | 2 | -1 | 7 | 16 | 7 | 8 | 3 | 5 | -1 |
| 1992 | 6 | 9 | 17 | 14 | 17 | 23 | 13 | 7 | 5 | 18 | 14 | 14 |
| 1993 | 10 | 23 | 27 | 43 | 34 | 18 | 25 | 24 | 28 | 31 | 28 | 43 |
| 1994 | 22 | 37 | 57 | 49 | 52 | 47 | 53 | 57 | 47 | 57 | 59 | 65 |
| 1995 | 62 | 37 | 59 | 79 | 53 | 63 | 74 | 72 | 62 | 50 | 48 | 57 |
| 1996 | 47 | 39 | 63 | 56 | 52 | 82 | 51 | 63 | 62 | 54 | 60 | 53 |
| 1997 | 59 | 46 | 45 | 71 | 66 | 72 | 62 | 60 | 66 | 54 | 53 | 62 |
| 1998 | 38 | 34 | 45 | 57 | 109 | 90 | 77 | 84 | 89 | 82 | 63 | 51 |
| 1999 | 64 | 43 | 53 | 69 | 83 | 89 | 81 | 69 | 75 | 85 | 75 | 75 |
| 2000 | 74 | 58 | 72 | 66 | 56 | 95 | 79 | 53 | 50 | 68 | 71 | 39 |
| 2001 | 39 | 50 | 59 | 78 | 109 | 110 | 69 | 84 | 104 | 99 | 105 | 76 |
| 2002 | 91 | 39 | 94 | 129 | 159 | 150 | 135 | 128 | 124 | 152 | 142 | 132 |
| 2003 | 95 | 69 | 116 | 171 | 204 | 189 | 171 | 159 | 131 | 155 | 135 | 132 |
| 2004 | 116 | 145 | 167 | 178 | 195 | 214 | 190 | 163 | 89 | 144 | 169 | 131 |
| 2005 | 129 | 144 | 133 | 150 | 165 | 116 | 160 | 192 | 114 | 124 | 177 | 143 |
| 2006 | 135 | 147 | 214 | 165 | 166 | 199 | 152 | 197 | 226 | 132 | 198 | 143 |
| 2007 | 125 | 105 | 113 | 136 | 177 | 197 | 166 | 173 | 167 | 128 | 189 | 180 |
| 2008 | 155 | 175 | 126 | 141 | 158 | 169 | 154 | 170 | 141 | 197 | 164 | 171 |
| 2009 | -157 | -218 | -203 | -188 | -188 | -231 | -245 | -293 | -282 | -296 | -308 | -335 |
| 2010 | -357 | -355 | -375 | -248 | -235 | -344 | -250 | -291 | -216 | -298 | -363 | -327 |
| 2011 | -340 | -376 | -413 | -323 | -246 | -216 | -170 | -258 | -217 | -308 | -340 | -352 |
| 2012 | -526 | -436 | -386 | -266 | -123 | -51 | -85 | -9 | -112 | -134 | -238 | -275 |
| 2013 | -289 | -292 | -82 | -174 | -85 | -94 | -165 | -196 | -97 | -243 | -338 | -438 |
| 2014 | -386 | -384 | -255 | -213 | -281 | -32 | -202 | -133 | -174 | -169 | -276 | -230 |
| 2015 | -277 | -294 | -391 | -270 | -193 | -168 | -176 | -159 | -222 | -112 | -318 | -438 |
| 2016 | -394 | -370 | -405 | -205 | -253 | -112 | -190 | -222 | -348 | -301 | -538 | -374 |
| 2017 | -482 | -426 | -517 | -317 | -350 | -302 | -305 | -308 | -449 | -328 | -378 | -600 |
| 2018 | -468 | -458 | -575 | -552 | -354 | -279 | -236 | -288 | -355 | -385 | -456 | -503 |
| 2019 | -551 | -509 | -354 | -394 | -307 | -278 | -291 | -330 | -329 | -434 | -458 | -501 |
| 2020 | -513 | -538 | -572 | -281 | -173 | -316 | -343 | -389 | -470 | -455 | -411 | -545 |
| 2021 | -594 | -411 | -487 | -399 | -324 | -385 | -370 | -427 | -462 | -528 | -526 | -639 |
| 2022 | -576 | -589 | -528 | -477 | -451 | -412 | -276 | -480 | -438 | -490 | -506 | -464 |
| 2023 | -507 | -559 | -605 | -450 | -438 | -435 | -432 | -400 | -439 | -498 | -545 | -640 |
| 2024 | -571 | |||||||||||
| - = No Data Reported; -- = Not Applicable; NA = Not Available; W = Withheld to avoid disclosure of individual company data. |
| Release Date: 3/29/2024 |
| Next Release Date: 4/30/2024 |