|
Download Data (XLS File) |
|
||||||||
|
||||||||
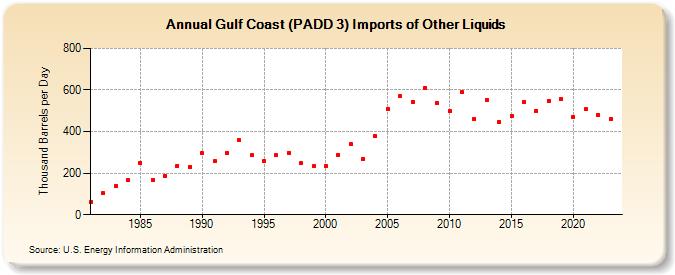
| Gulf Coast (PADD 3) Imports of Other Liquids (Thousand Barrels per Day) | ||||||||
| Decade | Year-0 | Year-1 | Year-2 | Year-3 | Year-4 | Year-5 | Year-6 | Year-7 | Year-8 | Year-9 |
|---|---|---|---|---|---|---|---|---|---|---|
| 1980's | 59 | 103 | 140 | 166 | 250 | 167 | 187 | 236 | 231 | |
| 1990's | 295 | 256 | 298 | 358 | 285 | 257 | 286 | 299 | 247 | 232 |
| 2000's | 234 | 289 | 339 | 269 | 378 | 509 | 569 | 543 | 611 | 537 |
| 2010's | 498 | 588 | 461 | 552 | 447 | 475 | 541 | 501 | 549 | 556 |
| 2020's | 471 | 507 | 481 | 462 |
| - = No Data Reported; -- = Not Applicable; NA = Not Available; W = Withheld to avoid disclosure of individual company data. |
| Release Date: 4/30/2024 |
| Next Release Date: 8/30/2024 |