|
Download Data (XLS File) |
|
||||||||
|
||||||||
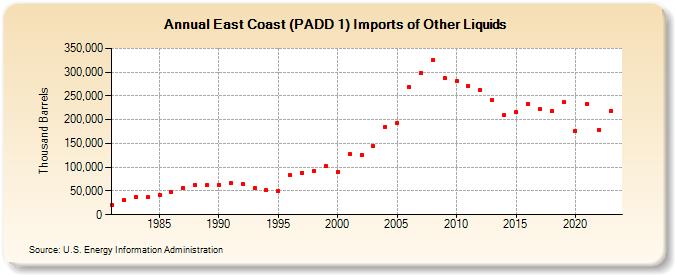
| East Coast (PADD 1) Imports of Other Liquids (Thousand Barrels) | ||||||||
| Decade | Year-0 | Year-1 | Year-2 | Year-3 | Year-4 | Year-5 | Year-6 | Year-7 | Year-8 | Year-9 |
|---|---|---|---|---|---|---|---|---|---|---|
| 1980's | 21,086 | 30,679 | 37,144 | 36,842 | 41,039 | 48,151 | 55,846 | 62,918 | 62,721 | |
| 1990's | 63,198 | 66,972 | 63,646 | 55,353 | 51,026 | 50,427 | 83,893 | 88,627 | 92,781 | 101,495 |
| 2000's | 90,697 | 127,177 | 126,220 | 143,735 | 185,536 | 192,063 | 268,619 | 297,976 | 325,264 | 286,704 |
| 2010's | 280,604 | 271,845 | 262,372 | 240,595 | 208,783 | 215,455 | 232,984 | 221,540 | 217,560 | 236,532 |
| 2020's | 176,073 | 233,644 | 179,278 | 218,287 |
| - = No Data Reported; -- = Not Applicable; NA = Not Available; W = Withheld to avoid disclosure of individual company data. |
| Release Date: 8/30/2024 |
| Next Release Date: 8/29/2025 |