|
Download Data (XLS File) |
|
||||||||
|
||||||||
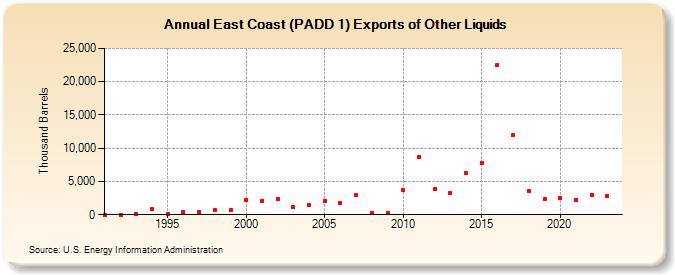
| East Coast (PADD 1) Exports of Other Liquids (Thousand Barrels) | ||||||||
| Decade | Year-0 | Year-1 | Year-2 | Year-3 | Year-4 | Year-5 | Year-6 | Year-7 | Year-8 | Year-9 |
|---|---|---|---|---|---|---|---|---|---|---|
| 1990's | 0 | 0 | 37 | 878 | 62 | 379 | 345 | 638 | 640 | |
| 2000's | 2,238 | 2,103 | 2,426 | 1,111 | 1,410 | 2,057 | 1,824 | 2,922 | 316 | 254 |
| 2010's | 3,668 | 8,673 | 3,837 | 3,270 | 6,263 | 7,810 | 22,437 | 11,974 | 3,623 | 2,347 |
| 2020's | 2,533 | 2,283 | 2,989 | 2,772 |
| - = No Data Reported; -- = Not Applicable; NA = Not Available; W = Withheld to avoid disclosure of individual company data. |
| Release Date: 3/29/2024 |
| Next Release Date: 8/30/2024 |