|
Download Data (XLS File) |
|
||||||||
|
||||||||
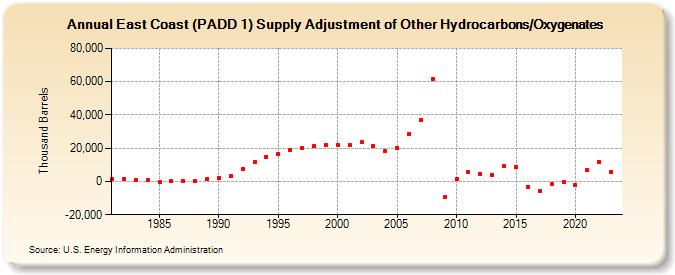
| East Coast (PADD 1) Supply Adjustment of Other Hydrocarbons/Oxygenates (Thousand Barrels) | ||||||||
| Decade | Year-0 | Year-1 | Year-2 | Year-3 | Year-4 | Year-5 | Year-6 | Year-7 | Year-8 | Year-9 |
|---|---|---|---|---|---|---|---|---|---|---|
| 1980's | 1,292 | 1,665 | 1,011 | 780 | -55 | 103 | 116 | 392 | 1,570 | |
| 1990's | 2,080 | 3,247 | 7,678 | 11,939 | 14,869 | 16,625 | 18,678 | 19,975 | 21,199 | 22,170 |
| 2000's | 21,775 | 21,873 | 23,476 | 21,341 | 18,039 | 20,107 | 28,546 | 37,111 | 61,725 | -9,619 |
| 2010's | 1,250 | 5,547 | 4,352 | 3,708 | 9,111 | 8,907 | -3,333 | -5,657 | -1,774 | -365 |
| 2020's | -2,237 | 7,132 | 11,746 | 5,433 |
| - = No Data Reported; -- = Not Applicable; NA = Not Available; W = Withheld to avoid disclosure of individual company data. |
| Release Date: 8/30/2024 |
| Next Release Date: 8/29/2025 |