|
Download Data (XLS File) |
|
||||||||
|
||||||||
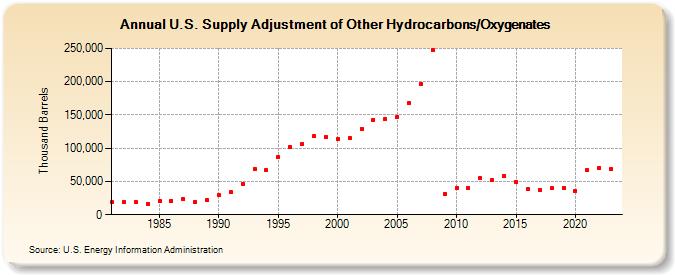
| U.S. Supply Adjustment of Other Hydrocarbons/Oxygenates (Thousand Barrels) | ||||||||
| Decade | Year-0 | Year-1 | Year-2 | Year-3 | Year-4 | Year-5 | Year-6 | Year-7 | Year-8 | Year-9 |
|---|---|---|---|---|---|---|---|---|---|---|
| 1980's | 18,372 | 19,229 | 19,257 | 16,586 | 20,097 | 21,123 | 23,321 | 19,536 | 21,991 | |
| 1990's | 29,253 | 33,531 | 46,812 | 68,394 | 66,647 | 87,010 | 101,968 | 106,879 | 117,588 | 116,638 |
| 2000's | 114,034 | 115,654 | 129,368 | 142,843 | 143,646 | 146,970 | 167,613 | 196,670 | 247,679 | 31,306 |
| 2010's | 40,131 | 39,470 | 55,119 | 51,613 | 58,159 | 49,688 | 38,463 | 36,824 | 39,492 | 39,999 |
| 2020's | 36,075 | 66,741 | 70,890 | 67,964 |
| - = No Data Reported; -- = Not Applicable; NA = Not Available; W = Withheld to avoid disclosure of individual company data. |
| Release Date: 3/29/2024 |
| Next Release Date: 8/30/2024 |