|
Download Data (XLS File) |
|
||||||||
|
||||||||
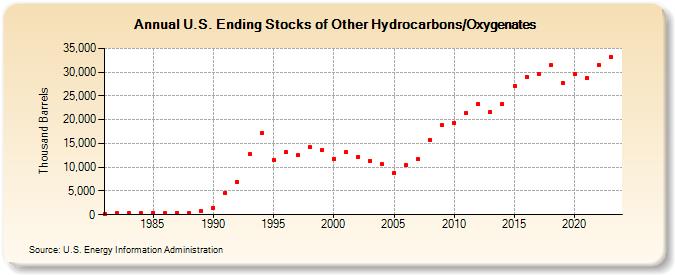
| U.S. Ending Stocks of Other Hydrocarbons/Oxygenates (Thousand Barrels) | ||||||||
| Decade | Year-0 | Year-1 | Year-2 | Year-3 | Year-4 | Year-5 | Year-6 | Year-7 | Year-8 | Year-9 |
|---|---|---|---|---|---|---|---|---|---|---|
| 1980's | 208 | 311 | 285 | 299 | 384 | 410 | 427 | 448 | 682 | |
| 1990's | 1,466 | 4,642 | 6,876 | 12,673 | 17,187 | 11,606 | 13,132 | 12,493 | 14,172 | 13,639 |
| 2000's | 11,822 | 13,162 | 12,178 | 11,369 | 10,615 | 8,844 | 10,447 | 11,650 | 15,784 | 18,777 |
| 2010's | 19,364 | 21,376 | 23,311 | 21,647 | 23,345 | 27,146 | 29,008 | 29,585 | 31,433 | 27,810 |
| 2020's | 29,656 | 28,675 | 31,550 | 33,212 |
| - = No Data Reported; -- = Not Applicable; NA = Not Available; W = Withheld to avoid disclosure of individual company data. |
| Release Date: 3/29/2024 |
| Next Release Date: 8/30/2024 |