|
Download Data (XLS File) |
|
||||||||
|
||||||||
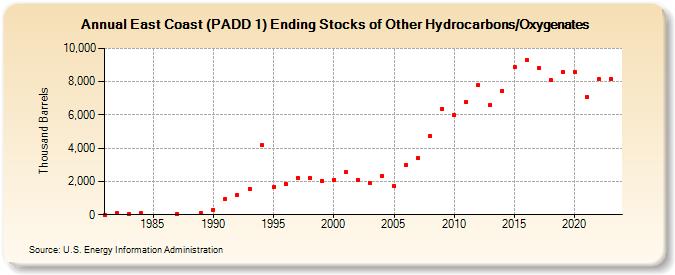
| East Coast (PADD 1) Ending Stocks of Other Hydrocarbons/Oxygenates (Thousand Barrels) | ||||||||
| Decade | Year-0 | Year-1 | Year-2 | Year-3 | Year-4 | Year-5 | Year-6 | Year-7 | Year-8 | Year-9 |
|---|---|---|---|---|---|---|---|---|---|---|
| 1980's | 5 | 109 | 50 | 80 | 20 | 91 | ||||
| 1990's | 300 | 956 | 1,212 | 1,560 | 4,181 | 1,664 | 1,876 | 2,236 | 2,234 | 2,051 |
| 2000's | 2,089 | 2,549 | 2,108 | 1,903 | 2,349 | 1,715 | 2,980 | 3,402 | 4,733 | 6,385 |
| 2010's | 5,982 | 6,779 | 7,805 | 6,606 | 7,455 | 8,858 | 9,291 | 8,809 | 8,094 | 8,568 |
| 2020's | 8,604 | 7,074 | 8,139 | 8,154 |
| - = No Data Reported; -- = Not Applicable; NA = Not Available; W = Withheld to avoid disclosure of individual company data. |
| Release Date: 8/30/2024 |
| Next Release Date: 8/29/2025 |