|
Download Data (XLS File) |
|
||||||||
|
||||||||
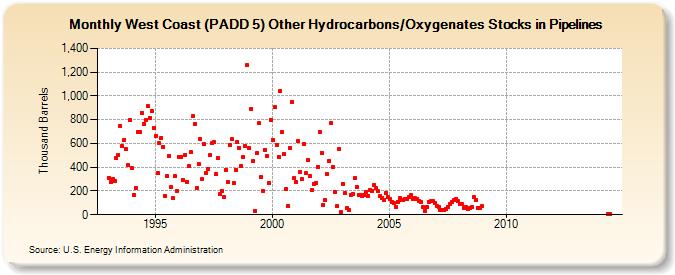
| West Coast (PADD 5) Other Hydrocarbons/Oxygenates Stocks in Pipelines (Thousand Barrels) | ||||||||
| Year | Jan | Feb | Mar | Apr | May | Jun | Jul | Aug | Sep | Oct | Nov | Dec |
|---|---|---|---|---|---|---|---|---|---|---|---|---|
| 1993 | 311 | 274 | 298 | 284 | 474 | 504 | 744 | 580 | 633 | 553 | 415 | 796 |
| 1994 | 397 | 167 | 228 | 698 | 698 | 859 | 767 | 798 | 915 | 818 | 875 | 731 |
| 1995 | 666 | 350 | 601 | 647 | 574 | 161 | 323 | 494 | 230 | 141 | 323 | 202 |
| 1996 | 487 | 488 | 290 | 502 | 279 | 407 | 526 | 827 | 766 | 224 | 427 | 637 |
| 1997 | 297 | 592 | 353 | 389 | 500 | 603 | 608 | 341 | 476 | 174 | 203 | 146 |
| 1998 | 380 | 274 | 589 | 634 | 265 | 375 | 614 | 560 | 410 | 484 | 578 | 1,257 |
| 1999 | 560 | 894 | 452 | 33 | 520 | 769 | 314 | 202 | 547 | 495 | 268 | 801 |
| 2000 | 631 | 906 | 589 | 485 | 1,043 | 693 | 511 | 217 | 72 | 561 | 951 | 305 |
| 2001 | 275 | 620 | 356 | 300 | 595 | 347 | 460 | 323 | 212 | 259 | 271 | 404 |
| 2002 | 698 | 522 | 84 | 120 | 343 | 456 | 770 | 401 | 192 | 71 | 549 | 19 |
| 2003 | 261 | 180 | 53 | 40 | 168 | 178 | 306 | 236 | 167 | 168 | 156 | 163 |
| 2004 | 190 | 159 | 209 | 201 | 250 | 224 | 196 | 158 | 143 | 126 | 183 | 148 |
| 2005 | 131 | 110 | 98 | 67 | 110 | 137 | 126 | 121 | 134 | 135 | 147 | 164 |
| 2006 | 133 | 138 | 136 | 113 | 105 | 67 | 35 | 66 | 111 | 112 | 117 | 97 |
| 2007 | 76 | 62 | 38 | 39 | 38 | 52 | 65 | 93 | 111 | 125 | 133 | 112 |
| 2008 | 94 | 86 | 57 | 66 | 48 | 53 | 63 | 149 | 123 | 60 | 54 | 71 |
| 2014 | 2 | 2 | ||||||||||
| - = No Data Reported; -- = Not Applicable; NA = Not Available; W = Withheld to avoid disclosure of individual company data. |
| Release Date: 4/30/2024 |
| Next Release Date: 5/31/2024 |