|
Download Data (XLS File) |
|
||||||||
|
||||||||
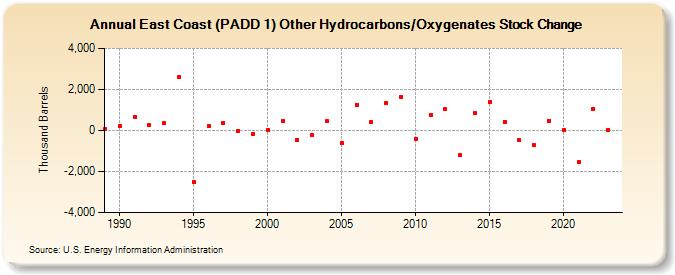
| East Coast (PADD 1) Other Hydrocarbons/Oxygenates Stock Change (Thousand Barrels) | ||||||||
| Decade | Year-0 | Year-1 | Year-2 | Year-3 | Year-4 | Year-5 | Year-6 | Year-7 | Year-8 | Year-9 |
|---|---|---|---|---|---|---|---|---|---|---|
| 1980's | 91 | |||||||||
| 1990's | 209 | 656 | 256 | 348 | 2,621 | -2,517 | 212 | 360 | -2 | -183 |
| 2000's | 38 | 460 | -441 | -205 | 446 | -634 | 1,265 | 422 | 1,331 | 1,652 |
| 2010's | -403 | 774 | 1,026 | -1,199 | 849 | 1,403 | 433 | -481 | -715 | 474 |
| 2020's | 36 | -1,530 | 1,065 | 14 |
| - = No Data Reported; -- = Not Applicable; NA = Not Available; W = Withheld to avoid disclosure of individual company data. |
| Release Date: 8/30/2024 |
| Next Release Date: 8/29/2025 |