|
Download Data (XLS File) |
|
||||||||
|
||||||||
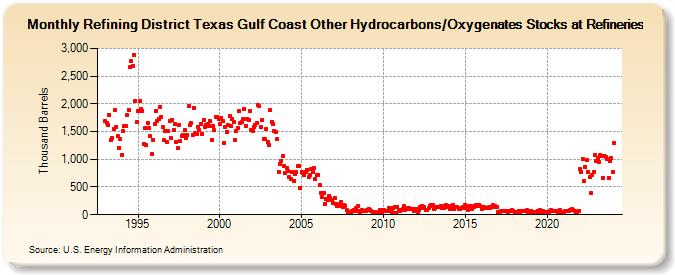
| Refining District Texas Gulf Coast Other Hydrocarbons/Oxygenates Stocks at Refineries (Thousand Barrels) | ||||||||
| Year | Jan | Feb | Mar | Apr | May | Jun | Jul | Aug | Sep | Oct | Nov | Dec |
|---|---|---|---|---|---|---|---|---|---|---|---|---|
| 1993 | 1,684 | 1,652 | 1,621 | 1,805 | 1,345 | 1,381 | 1,540 | 1,883 | 1,590 | 1,411 | 1,210 | 1,358 |
| 1994 | 1,082 | 1,511 | 1,598 | 1,592 | 1,794 | 1,891 | 2,658 | 2,777 | 2,683 | 2,877 | 2,057 | 1,668 |
| 1995 | 1,867 | 2,045 | 1,903 | 1,878 | 1,281 | 1,559 | 1,250 | 1,649 | 1,563 | 1,414 | 1,092 | 1,350 |
| 1996 | 1,630 | 1,873 | 1,694 | 1,732 | 1,948 | 1,766 | 1,583 | 1,347 | 1,503 | 1,313 | 1,514 | 1,693 |
| 1997 | 1,387 | 1,710 | 1,528 | 1,632 | 1,304 | 1,201 | 1,626 | 1,322 | 1,411 | 1,442 | 1,519 | 1,376 |
| 1998 | 1,430 | 1,953 | 1,619 | 1,651 | 1,444 | 1,925 | 1,465 | 1,458 | 1,591 | 1,526 | 1,642 | 1,447 |
| 1999 | 1,703 | 1,577 | 1,610 | 1,631 | 1,607 | 1,682 | 1,339 | 1,595 | 1,523 | 1,768 | 1,762 | 1,729 |
| 2000 | 1,631 | 1,751 | 1,699 | 1,291 | 1,580 | 1,494 | 1,614 | 1,781 | 1,604 | 1,733 | 1,672 | 1,356 |
| 2001 | 1,516 | 1,570 | 1,867 | 1,650 | 1,670 | 1,730 | 1,904 | 1,600 | 1,732 | 1,702 | 1,879 | 1,526 |
| 2002 | 1,512 | 1,578 | 1,615 | 1,660 | 1,987 | 1,954 | 1,575 | 1,705 | 1,367 | 1,374 | 1,544 | 1,309 |
| 2003 | 1,256 | 1,885 | 1,678 | 1,632 | 1,507 | 1,483 | 1,370 | 766 | 920 | 977 | 1,055 | 870 |
| 2004 | 756 | 846 | 782 | 679 | 645 | 766 | 614 | 727 | 770 | 875 | 875 | 484 |
| 2005 | 764 | 748 | 715 | 778 | 811 | 680 | 716 | 829 | 776 | 840 | 644 | 712 |
| 2006 | 719 | 535 | 395 | 322 | 387 | 199 | 292 | 259 | 339 | 304 | 273 | 204 |
| 2007 | 301 | 201 | 160 | 164 | 187 | 228 | 146 | 180 | 165 | 85 | 36 | 46 |
| 2008 | 55 | 74 | 85 | 74 | 120 | 151 | 58 | 48 | 84 | 69 | 61 | 67 |
| 2009 | 88 | 107 | 87 | 67 | 47 | 54 | 25 | 31 | 52 | 90 | 84 | 54 |
| 2010 | 88 | 59 | 67 | 64 | 130 | 63 | 56 | 124 | 142 | 38 | 133 | 81 |
| 2011 | 67 | 89 | 99 | 158 | 89 | 111 | 117 | 113 | 112 | 106 | 66 | 107 |
| 2012 | 103 | 40 | 86 | 144 | 153 | 117 | 141 | 89 | 94 | 114 | 151 | 178 |
| 2013 | 173 | 99 | 113 | 145 | 136 | 135 | 161 | 123 | 124 | 158 | 167 | 135 |
| 2014 | 163 | 109 | 131 | 176 | 99 | 144 | 135 | 100 | 108 | 119 | 134 | 125 |
| 2015 | 178 | 162 | 88 | 108 | 164 | 100 | 133 | 152 | 169 | 156 | 179 | 158 |
| 2016 | 101 | 143 | 133 | 127 | 128 | 136 | 122 | 139 | 168 | 137 | 160 | 143 |
| 2017 | 53 | 43 | 61 | 66 | 69 | 65 | 64 | 45 | 62 | 63 | 77 | 75 |
| 2018 | 47 | 50 | 43 | 71 | 52 | 67 | 64 | 67 | 76 | 79 | 44 | 48 |
| 2019 | 66 | 48 | 32 | 50 | 48 | 68 | 54 | 78 | 57 | 66 | 43 | 54 |
| 2020 | 56 | 43 | 75 | 81 | 62 | 61 | 64 | 73 | 52 | 82 | 29 | 24 |
| 2021 | 48 | 73 | 69 | 70 | 76 | 82 | 107 | 84 | 58 | 56 | 49 | 73 |
| 2022 | 822 | 763 | 1,001 | 613 | 867 | 980 | 777 | 684 | 383 | 720 | 772 | 1,075 |
| 2023 | 975 | 1,020 | 956 | 1,075 | 1,066 | 668 | 1,063 | 1,041 | 997 | 668 | 961 | 1,015 |
| 2024 | 773 | |||||||||||
| - = No Data Reported; -- = Not Applicable; NA = Not Available; W = Withheld to avoid disclosure of individual company data. |
| Release Date: 3/29/2024 |
| Next Release Date: 4/30/2024 |