|
Download Data (XLS File) |
|
||||||||
|
||||||||
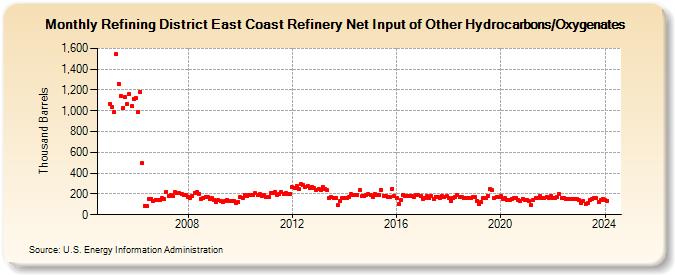
| Refining District East Coast Refinery Net Input of Other Hydrocarbons/Oxygenates (Thousand Barrels) | ||||||||
| Year | Jan | Feb | Mar | Apr | May | Jun | Jul | Aug | Sep | Oct | Nov | Dec |
|---|---|---|---|---|---|---|---|---|---|---|---|---|
| 2005 | 1,069 | 1,037 | 987 | 1,543 | 1,262 | 1,142 | 1,027 | 1,129 | 1,066 | 1,159 | 1,043 | 1,111 |
| 2006 | 1,120 | 990 | 1,183 | 497 | 85 | 87 | 152 | 154 | 134 | 146 | 139 | 143 |
| 2007 | 158 | 151 | 221 | 179 | 188 | 179 | 214 | 208 | 206 | 204 | 190 | 192 |
| 2008 | 174 | 163 | 179 | 213 | 217 | 202 | 155 | 156 | 171 | 168 | 155 | 158 |
| 2009 | 146 | 126 | 137 | 135 | 127 | 132 | 142 | 128 | 128 | 131 | 117 | 127 |
| 2010 | 168 | 161 | 194 | 181 | 188 | 186 | 189 | 206 | 190 | 196 | 181 | 189 |
| 2011 | 169 | 167 | 212 | 211 | 221 | 194 | 196 | 217 | 200 | 207 | 202 | 203 |
| 2012 | 267 | 260 | 279 | 249 | 300 | 288 | 269 | 277 | 260 | 268 | 255 | 235 |
| 2013 | 249 | 241 | 267 | 248 | 235 | 161 | 170 | 160 | 161 | 91 | 131 | 161 |
| 2014 | 161 | 160 | 173 | 196 | 194 | 185 | 186 | 234 | 176 | 180 | 192 | 201 |
| 2015 | 186 | 167 | 199 | 186 | 192 | 240 | 183 | 178 | 171 | 175 | 252 | 178 |
| 2016 | 161 | 99 | 144 | 193 | 183 | 184 | 180 | 179 | 173 | 187 | 186 | 180 |
| 2017 | 154 | 165 | 177 | 162 | 178 | 152 | 173 | 168 | 158 | 177 | 169 | 177 |
| 2018 | 164 | 133 | 165 | 173 | 185 | 169 | 167 | 165 | 160 | 163 | 158 | 171 |
| 2019 | 169 | 136 | 99 | 118 | 161 | 156 | 184 | 243 | 233 | 164 | 168 | 174 |
| 2020 | 178 | 152 | 163 | 146 | 140 | 149 | 157 | 160 | 143 | 136 | 154 | 143 |
| 2021 | 144 | 130 | 91 | 145 | 160 | 165 | 176 | 164 | 165 | 171 | 165 | 177 |
| 2022 | 160 | 163 | 168 | 197 | 162 | 163 | 151 | 155 | 151 | 148 | 151 | 154 |
| 2023 | 143 | 112 | 129 | 104 | 115 | 142 | 152 | 159 | 158 | 126 | 142 | 147 |
| 2024 | 142 | |||||||||||
| - = No Data Reported; -- = Not Applicable; NA = Not Available; W = Withheld to avoid disclosure of individual company data. |
| Release Date: 3/29/2024 |
| Next Release Date: 4/30/2024 |