|
Download Data (XLS File) |
|
||||||||
|
||||||||
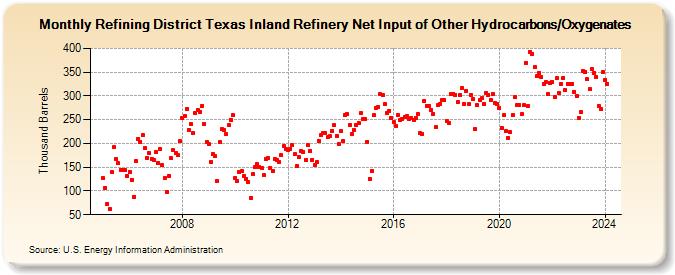
| Refining District Texas Inland Refinery Net Input of Other Hydrocarbons/Oxygenates (Thousand Barrels) | ||||||||
| Year | Jan | Feb | Mar | Apr | May | Jun | Jul | Aug | Sep | Oct | Nov | Dec |
|---|---|---|---|---|---|---|---|---|---|---|---|---|
| 2005 | 127 | 107 | 73 | 62 | 139 | 192 | 167 | 158 | 145 | 144 | 144 | 131 |
| 2006 | 140 | 124 | 88 | 163 | 210 | 204 | 217 | 190 | 170 | 180 | 168 | 166 |
| 2007 | 182 | 159 | 189 | 154 | 127 | 98 | 132 | 169 | 186 | 179 | 175 | 205 |
| 2008 | 253 | 258 | 273 | 229 | 240 | 221 | 264 | 270 | 267 | 279 | 240 | 204 |
| 2009 | 199 | 161 | 177 | 173 | 120 | 202 | 230 | 229 | 219 | 238 | 250 | 259 |
| 2010 | 127 | 120 | 139 | 141 | 132 | 126 | 118 | 86 | 136 | 150 | 156 | 150 |
| 2011 | 149 | 133 | 167 | 169 | 148 | 141 | 167 | 165 | 161 | 175 | 194 | 189 |
| 2012 | 187 | 189 | 196 | 177 | 152 | 172 | 185 | 182 | 166 | 196 | 185 | 166 |
| 2013 | 154 | 161 | 206 | 217 | 223 | 223 | 213 | 215 | 227 | 238 | 216 | 199 |
| 2014 | 226 | 205 | 259 | 261 | 239 | 220 | 228 | 238 | 243 | 263 | 251 | 251 |
| 2015 | 204 | 126 | 143 | 259 | 275 | 277 | 304 | 301 | 282 | 264 | 269 | 254 |
| 2016 | 245 | 237 | 260 | 249 | 252 | 256 | 257 | 252 | 253 | 250 | 254 | 262 |
| 2017 | 221 | 220 | 290 | 279 | 279 | 270 | 262 | 234 | 280 | 283 | 292 | 291 |
| 2018 | 247 | 244 | 305 | 305 | 302 | 287 | 302 | 317 | 284 | 310 | 282 | 301 |
| 2019 | 293 | 230 | 280 | 291 | 295 | 283 | 307 | 302 | 292 | 304 | 285 | 284 |
| 2020 | 275 | 233 | 259 | 226 | 211 | 224 | 260 | 297 | 280 | 281 | 261 | 280 |
| 2021 | 370 | 279 | 393 | 389 | 360 | 341 | 349 | 340 | 326 | 329 | 303 | 327 |
| 2022 | 330 | 298 | 337 | 306 | 326 | 338 | 312 | 326 | 326 | 325 | 309 | 300 |
| 2023 | 254 | 266 | 353 | 351 | 335 | 314 | 357 | 349 | 340 | 279 | 272 | 350 |
| 2024 | 334 | |||||||||||
| - = No Data Reported; -- = Not Applicable; NA = Not Available; W = Withheld to avoid disclosure of individual company data. |
| Release Date: 3/29/2024 |
| Next Release Date: 4/30/2024 |