|
Download Data (XLS File) |
|
||||||||
|
||||||||
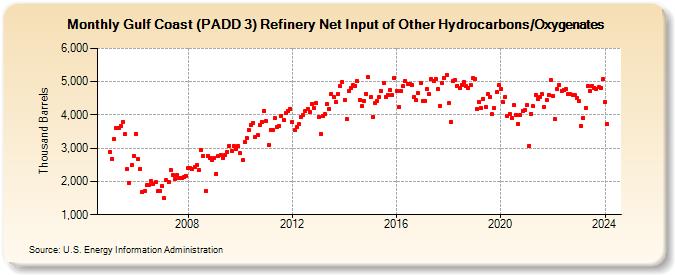
| Gulf Coast (PADD 3) Refinery Net Input of Other Hydrocarbons/Oxygenates (Thousand Barrels) | ||||||||
| Year | Jan | Feb | Mar | Apr | May | Jun | Jul | Aug | Sep | Oct | Nov | Dec |
|---|---|---|---|---|---|---|---|---|---|---|---|---|
| 2005 | 2,887 | 2,676 | 3,277 | 3,605 | 3,616 | 3,677 | 3,799 | 3,425 | 2,362 | 1,965 | 2,493 | 2,776 |
| 2006 | 3,434 | 2,669 | 2,383 | 1,682 | 1,714 | 1,880 | 1,893 | 1,999 | 1,935 | 1,971 | 1,712 | 1,720 |
| 2007 | 1,867 | 1,491 | 2,034 | 1,992 | 2,351 | 2,200 | 2,082 | 2,207 | 2,097 | 2,109 | 2,136 | 2,173 |
| 2008 | 2,392 | 2,390 | 2,374 | 2,430 | 2,496 | 2,333 | 2,937 | 2,761 | 1,722 | 2,768 | 2,711 | 2,655 |
| 2009 | 2,705 | 2,235 | 2,765 | 2,794 | 2,712 | 2,796 | 2,894 | 3,070 | 2,919 | 3,068 | 2,967 | 3,060 |
| 2010 | 2,843 | 2,634 | 3,178 | 3,305 | 3,553 | 3,686 | 3,761 | 3,337 | 3,383 | 3,690 | 3,798 | 4,124 |
| 2011 | 3,803 | 3,098 | 3,553 | 3,551 | 3,903 | 3,639 | 3,675 | 3,968 | 3,840 | 4,045 | 4,124 | 4,191 |
| 2012 | 3,788 | 3,532 | 3,643 | 3,717 | 3,937 | 4,011 | 4,118 | 4,180 | 4,098 | 4,335 | 4,206 | 4,358 |
| 2013 | 3,931 | 3,427 | 3,981 | 4,023 | 4,320 | 4,184 | 4,635 | 4,529 | 4,385 | 4,636 | 4,857 | 4,991 |
| 2014 | 4,457 | 3,869 | 4,716 | 4,796 | 4,885 | 4,879 | 5,007 | 4,458 | 4,274 | 4,421 | 4,640 | 5,125 |
| 2015 | 4,525 | 3,927 | 4,354 | 4,412 | 4,524 | 4,713 | 4,963 | 4,551 | 4,593 | 4,754 | 4,599 | 5,112 |
| 2016 | 4,729 | 4,245 | 4,712 | 4,868 | 5,013 | 4,936 | 4,943 | 4,897 | 4,540 | 4,434 | 4,658 | 4,963 |
| 2017 | 4,413 | 4,404 | 4,781 | 4,626 | 5,077 | 5,012 | 5,081 | 4,780 | 4,281 | 4,960 | 5,115 | 5,201 |
| 2018 | 4,345 | 3,801 | 5,016 | 5,047 | 4,879 | 4,813 | 4,907 | 4,997 | 4,862 | 4,817 | 4,910 | 5,109 |
| 2019 | 5,071 | 4,172 | 4,400 | 4,197 | 4,483 | 4,250 | 4,617 | 4,538 | 4,013 | 4,200 | 4,680 | 4,886 |
| 2020 | 4,793 | 4,385 | 4,543 | 3,981 | 4,035 | 3,906 | 4,285 | 3,998 | 3,730 | 3,994 | 4,123 | 4,157 |
| 2021 | 4,304 | 3,079 | 4,040 | 4,255 | 4,611 | 4,482 | 4,540 | 4,620 | 4,240 | 4,463 | 4,594 | 5,043 |
| 2022 | 4,579 | 3,869 | 4,770 | 4,908 | 4,728 | 4,739 | 4,773 | 4,636 | 4,618 | 4,612 | 4,588 | 4,515 |
| 2023 | 4,434 | 3,664 | 3,916 | 4,214 | 4,863 | 4,722 | 4,872 | 4,842 | 4,772 | 4,825 | 4,817 | 5,070 |
| 2024 | 4,401 | 3,713 | 4,896 | 4,931 | 4,893 | 4,539 | ||||||
| - = No Data Reported; -- = Not Applicable; NA = Not Available; W = Withheld to avoid disclosure of individual company data. |
| Release Date: 8/30/2024 |
| Next Release Date: 9/30/2024 |