|
Download Data (XLS File) |
|
||||||||
|
||||||||
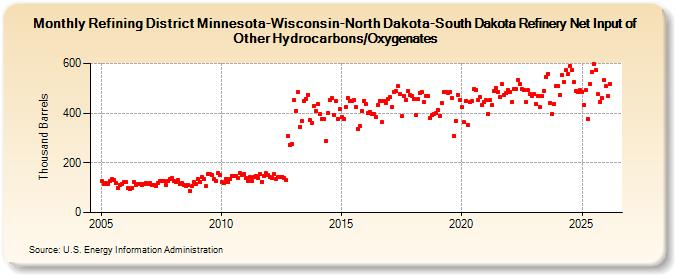
| Refining District Minnesota-Wisconsin-North Dakota-South Dakota Refinery Net Input of Other Hydrocarbons/Oxygenates (Thousand Barrels) | ||||||||
| Year | Jan | Feb | Mar | Apr | May | Jun | Jul | Aug | Sep | Oct | Nov | Dec |
|---|---|---|---|---|---|---|---|---|---|---|---|---|
| 2005 | 127 | 115 | 118 | 116 | 128 | 135 | 132 | 120 | 100 | 112 | 116 | 122 |
| 2006 | 125 | 100 | 96 | 97 | 125 | 109 | 114 | 116 | 109 | 115 | 119 | 113 |
| 2007 | 118 | 109 | 111 | 105 | 120 | 126 | 127 | 127 | 111 | 128 | 135 | 138 |
| 2008 | 129 | 123 | 130 | 113 | 118 | 112 | 106 | 112 | 86 | 105 | 125 | 114 |
| 2009 | 134 | 123 | 144 | 135 | 105 | 155 | 156 | 152 | 134 | 128 | 159 | 151 |
| 2010 | 122 | 120 | 136 | 123 | 136 | 149 | 146 | 149 | 138 | 158 | 153 | 154 |
| 2011 | 139 | 129 | 142 | 129 | 144 | 149 | 141 | 157 | 124 | 146 | 158 | 151 |
| 2012 | 143 | 141 | 154 | 136 | 142 | 145 | 145 | 141 | 130 | 307 | 272 | 276 |
| 2013 | 452 | 410 | 484 | 346 | 368 | 447 | 459 | 475 | 372 | 361 | 430 | 407 |
| 2014 | 436 | 395 | 377 | 378 | 287 | 401 | 455 | 461 | 392 | 450 | 378 | 415 |
| 2015 | 383 | 376 | 425 | 462 | 447 | 448 | 453 | 425 | 336 | 348 | 409 | 451 |
| 2016 | 437 | 399 | 405 | 398 | 397 | 385 | 432 | 451 | 363 | 451 | 442 | 459 |
| 2017 | 464 | 424 | 486 | 488 | 508 | 476 | 387 | 471 | 453 | 491 | 473 | 468 |
| 2018 | 459 | 392 | 457 | 481 | 484 | 444 | 471 | 469 | 380 | 391 | 397 | 399 |
| 2019 | 414 | 389 | 440 | 484 | 486 | 480 | 484 | 463 | 310 | 369 | 475 | 455 |
| 2020 | 423 | 363 | 450 | 353 | 443 | 447 | 497 | 495 | 453 | 466 | 432 | 445 |
| 2021 | 452 | 398 | 452 | 434 | 488 | 503 | 486 | 467 | 516 | 475 | 480 | 493 |
| 2022 | 487 | 446 | 497 | 499 | 533 | 517 | 497 | 494 | 445 | 493 | 476 | 471 |
| 2023 | 476 | 437 | 471 | 423 | 471 | 490 | 546 | 559 | 440 | 398 | 436 | 508 |
| 2024 | 511 | |||||||||||
| - = No Data Reported; -- = Not Applicable; NA = Not Available; W = Withheld to avoid disclosure of individual company data. |
| Release Date: 3/29/2024 |
| Next Release Date: 4/30/2024 |