|
Download Data (XLS File) |
|
||||||||
|
||||||||
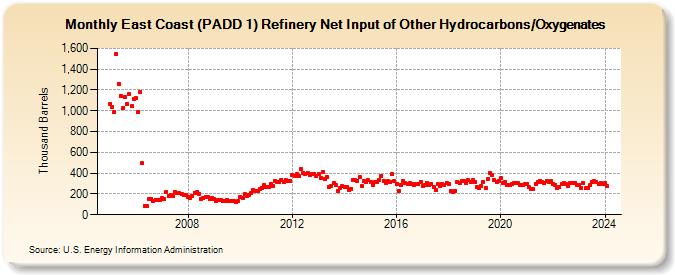
| East Coast (PADD 1) Refinery Net Input of Other Hydrocarbons/Oxygenates (Thousand Barrels) | ||||||||
| Year | Jan | Feb | Mar | Apr | May | Jun | Jul | Aug | Sep | Oct | Nov | Dec |
|---|---|---|---|---|---|---|---|---|---|---|---|---|
| 2005 | 1,069 | 1,037 | 987 | 1,543 | 1,262 | 1,142 | 1,027 | 1,129 | 1,066 | 1,159 | 1,043 | 1,111 |
| 2006 | 1,120 | 990 | 1,183 | 497 | 85 | 87 | 152 | 154 | 134 | 146 | 139 | 143 |
| 2007 | 158 | 151 | 221 | 179 | 188 | 179 | 214 | 208 | 206 | 204 | 190 | 192 |
| 2008 | 174 | 163 | 179 | 213 | 217 | 202 | 155 | 156 | 171 | 168 | 155 | 158 |
| 2009 | 148 | 128 | 139 | 137 | 128 | 133 | 143 | 130 | 130 | 133 | 119 | 129 |
| 2010 | 170 | 163 | 196 | 183 | 194 | 208 | 234 | 230 | 227 | 251 | 258 | 285 |
| 2011 | 270 | 263 | 297 | 275 | 326 | 318 | 318 | 338 | 315 | 336 | 327 | 327 |
| 2012 | 379 | 371 | 388 | 368 | 435 | 406 | 393 | 404 | 380 | 393 | 391 | 373 |
| 2013 | 387 | 357 | 414 | 344 | 362 | 271 | 278 | 304 | 290 | 231 | 255 | 273 |
| 2014 | 267 | 267 | 239 | 250 | 333 | 333 | 328 | 361 | 280 | 325 | 312 | 331 |
| 2015 | 318 | 283 | 312 | 310 | 336 | 377 | 329 | 309 | 322 | 313 | 390 | 322 |
| 2016 | 300 | 231 | 286 | 326 | 302 | 298 | 301 | 296 | 286 | 295 | 300 | 313 |
| 2017 | 276 | 286 | 309 | 287 | 295 | 270 | 239 | 293 | 280 | 296 | 289 | 303 |
| 2018 | 291 | 231 | 222 | 229 | 314 | 302 | 328 | 321 | 303 | 331 | 318 | 331 |
| 2019 | 317 | 262 | 254 | 274 | 314 | 256 | 346 | 398 | 383 | 336 | 317 | 328 |
| 2020 | 351 | 305 | 318 | 284 | 282 | 295 | 302 | 304 | 305 | 282 | 288 | 292 |
| 2021 | 291 | 263 | 250 | 245 | 296 | 312 | 327 | 316 | 309 | 320 | 312 | 323 |
| 2022 | 300 | 289 | 256 | 262 | 291 | 304 | 293 | 281 | 304 | 309 | 304 | 282 |
| 2023 | 282 | 256 | 302 | 254 | 261 | 283 | 315 | 321 | 312 | 294 | 302 | 291 |
| 2024 | 303 | |||||||||||
| - = No Data Reported; -- = Not Applicable; NA = Not Available; W = Withheld to avoid disclosure of individual company data. |
| Release Date: 3/29/2024 |
| Next Release Date: 4/30/2024 |