|
Download Data (XLS File) |
|
||||||||
|
||||||||
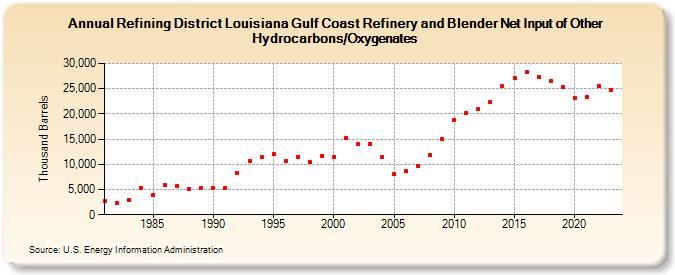
| Refining District Louisiana Gulf Coast Refinery and Blender Net Input of Other Hydrocarbons/Oxygenates (Thousand Barrels) | ||||||||
| Decade | Year-0 | Year-1 | Year-2 | Year-3 | Year-4 | Year-5 | Year-6 | Year-7 | Year-8 | Year-9 |
|---|---|---|---|---|---|---|---|---|---|---|
| 1980's | 2,718 | 2,324 | 2,906 | 5,370 | 3,817 | 5,836 | 5,726 | 5,041 | 5,230 | |
| 1990's | 5,334 | 5,228 | 8,286 | 10,716 | 11,389 | 12,067 | 10,705 | 11,520 | 10,421 | 11,680 |
| 2000's | 11,531 | 15,153 | 13,985 | 14,071 | 11,385 | 8,001 | 8,577 | 9,745 | 11,888 | 14,922 |
| 2010's | 18,700 | 20,250 | 20,896 | 22,331 | 25,439 | 27,214 | 28,344 | 27,351 | 26,537 | 25,418 |
| 2020's | 23,113 | 23,371 | 25,474 | 24,656 |
| - = No Data Reported; -- = Not Applicable; NA = Not Available; W = Withheld to avoid disclosure of individual company data. |
| Release Date: 3/29/2024 |
| Next Release Date: 8/30/2024 |