|
Download Data (XLS File) |
|
||||||||
|
||||||||
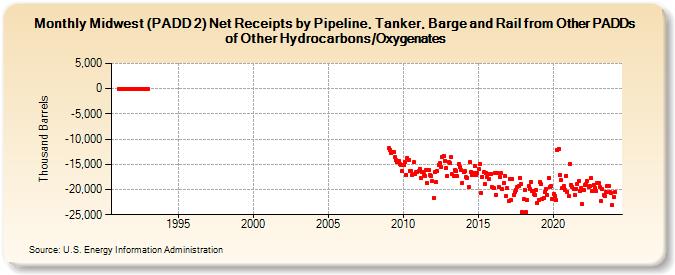
| Midwest (PADD 2) Net Receipts by Pipeline, Tanker, Barge and Rail from Other PADDs of Other Hydrocarbons/Oxygenates (Thousand Barrels) | ||||||||
| Year | Jan | Feb | Mar | Apr | May | Jun | Jul | Aug | Sep | Oct | Nov | Dec |
|---|---|---|---|---|---|---|---|---|---|---|---|---|
| 1991 | 0 | 0 | 0 | 0 | 0 | 0 | 0 | 0 | 0 | 0 | 0 | 0 |
| 1992 | 0 | 0 | 0 | 0 | 0 | 0 | 0 | 0 | 0 | 0 | 0 | 0 |
| 2009 | -11,835 | -12,111 | -12,799 | -12,567 | -12,640 | -13,627 | -14,149 | -14,525 | -14,313 | -14,848 | -15,207 | -16,287 |
| 2010 | -15,086 | -14,555 | -17,075 | -13,799 | -14,119 | -16,305 | -16,368 | -17,103 | -14,628 | -16,830 | -16,438 | -16,558 |
| 2011 | -16,317 | -15,850 | -17,688 | -16,474 | -16,895 | -17,291 | -16,207 | -18,735 | -16,150 | -17,122 | -17,309 | -18,320 |
| 2012 | -21,634 | -16,578 | -18,542 | -16,360 | -15,067 | -14,803 | -15,447 | -13,523 | -13,311 | -14,260 | -15,653 | -17,257 |
| 2013 | -14,446 | -14,839 | -13,634 | -17,015 | -17,287 | -16,173 | -16,322 | -17,419 | -15,030 | -15,505 | -16,144 | -18,628 |
| 2014 | -16,599 | -16,389 | -17,575 | -17,620 | -19,537 | -14,551 | -16,497 | -17,099 | -16,717 | -15,423 | -17,044 | -16,807 |
| 2015 | -15,973 | -14,934 | -20,602 | -17,454 | -16,577 | -18,903 | -16,641 | -17,542 | -17,957 | -16,834 | -16,895 | -19,589 |
| 2016 | -19,751 | -16,658 | -21,022 | -16,691 | -19,496 | -17,555 | -16,797 | -19,976 | -18,797 | -17,382 | -21,189 | -19,777 |
| 2017 | -22,314 | -17,830 | -22,126 | -17,856 | -21,122 | -20,582 | -20,031 | -19,442 | -19,342 | -17,675 | -18,914 | -24,464 |
| 2018 | -21,939 | -20,023 | -24,463 | -22,045 | -19,342 | -19,815 | -18,510 | -20,232 | -20,840 | -21,127 | -20,109 | -22,752 |
| 2019 | -21,985 | -18,564 | -19,003 | -21,800 | -21,749 | -20,568 | -19,847 | -21,068 | -17,663 | -19,454 | -19,375 | -21,895 |
| 2020 | -20,848 | -21,215 | -22,133 | -12,075 | -11,963 | -17,148 | -18,180 | -19,752 | -19,350 | -20,095 | -17,242 | -20,399 |
| 2021 | -21,320 | -14,876 | -19,071 | -19,417 | -19,971 | -21,052 | -19,806 | -18,875 | -18,389 | -20,367 | -19,713 | -22,894 |
| 2022 | -20,193 | -19,140 | -18,998 | -18,324 | -19,484 | -19,391 | -17,748 | -20,219 | -19,012 | -19,672 | -20,214 | -18,657 |
| 2023 | -18,712 | -19,540 | -22,357 | -19,952 | -21,095 | -21,374 | -20,571 | -19,208 | -19,323 | -20,528 | -20,582 | -23,090 |
| 2024 | -21,826 | |||||||||||
| - = No Data Reported; -- = Not Applicable; NA = Not Available; W = Withheld to avoid disclosure of individual company data. |
| Release Date: 3/29/2024 |
| Next Release Date: 4/30/2024 |