|
Download Data (XLS File) |
|
||||||||
|
||||||||
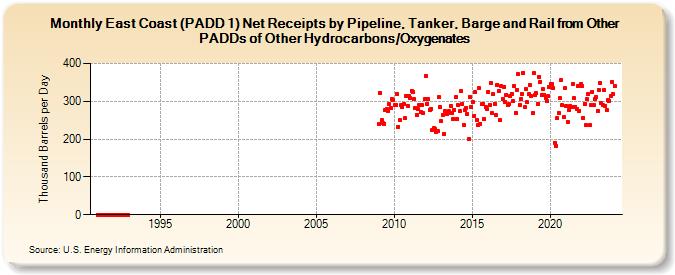
| East Coast (PADD 1) Net Receipts by Pipeline, Tanker, Barge and Rail from Other PADDs of Other Hydrocarbons/Oxygenates (Thousand Barrels per Day) | ||||||||
| Year | Jan | Feb | Mar | Apr | May | Jun | Jul | Aug | Sep | Oct | Nov | Dec |
|---|---|---|---|---|---|---|---|---|---|---|---|---|
| 1991 | 0 | 0 | 0 | 0 | 0 | 0 | 0 | 0 | 0 | 0 | 0 | 0 |
| 1992 | 0 | 0 | 0 | 0 | 0 | 0 | 0 | 0 | 0 | 0 | 0 | 0 |
| 2009 | 240 | 323 | 250 | 243 | 241 | 276 | 279 | 275 | 292 | 282 | 305 | 304 |
| 2010 | 290 | 291 | 320 | 233 | 250 | 290 | 284 | 293 | 255 | 314 | 288 | 314 |
| 2011 | 309 | 328 | 325 | 306 | 283 | 264 | 279 | 289 | 271 | 290 | 269 | 305 |
| 2012 | 368 | 293 | 305 | 277 | 280 | 223 | 229 | 228 | 220 | 222 | 311 | 284 |
| 2013 | 247 | 265 | 214 | 274 | 267 | 270 | 274 | 288 | 270 | 252 | 277 | 311 |
| 2014 | 254 | 289 | 273 | 327 | 293 | 238 | 277 | 283 | 267 | 201 | 312 | 284 |
| 2015 | 298 | 262 | 324 | 251 | 236 | 334 | 241 | 292 | 292 | 253 | 284 | 280 |
| 2016 | 325 | 291 | 349 | 269 | 318 | 294 | 263 | 344 | 328 | 250 | 340 | 306 |
| 2017 | 339 | 299 | 317 | 291 | 292 | 313 | 320 | 301 | 340 | 270 | 330 | 371 |
| 2018 | 290 | 306 | 320 | 376 | 284 | 332 | 297 | 318 | 343 | 313 | 268 | 374 |
| 2019 | 316 | 321 | 293 | 365 | 352 | 316 | 332 | 317 | 309 | 300 | 314 | 339 |
| 2020 | 347 | 346 | 334 | 191 | 183 | 255 | 270 | 308 | 355 | 289 | 258 | 334 |
| 2021 | 288 | 246 | 276 | 287 | 286 | 346 | 308 | 286 | 280 | 340 | 275 | 345 |
| 2022 | 340 | 256 | 294 | 237 | 305 | 319 | 236 | 290 | 325 | 290 | 306 | 311 |
| 2023 | 274 | 330 | 348 | 295 | 291 | 329 | 288 | 277 | 303 | 302 | 312 | 351 |
| 2024 | 331 | |||||||||||
| - = No Data Reported; -- = Not Applicable; NA = Not Available; W = Withheld to avoid disclosure of individual company data. |
| Release Date: 3/29/2024 |
| Next Release Date: 4/30/2024 |