|
Download Data (XLS File) |
|
||||||||
|
||||||||
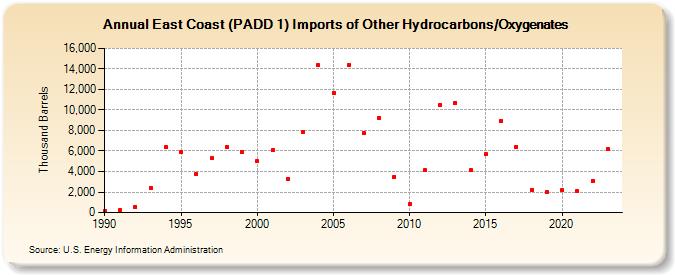
| East Coast (PADD 1) Imports of Other Hydrocarbons/Oxygenates (Thousand Barrels) | ||||||||
| Decade | Year-0 | Year-1 | Year-2 | Year-3 | Year-4 | Year-5 | Year-6 | Year-7 | Year-8 | Year-9 |
|---|---|---|---|---|---|---|---|---|---|---|
| 1990's | 173 | 264 | 576 | 2,398 | 6,369 | 5,946 | 3,766 | 5,271 | 6,402 | 5,937 |
| 2000's | 4,980 | 6,061 | 3,247 | 7,809 | 14,339 | 11,699 | 14,398 | 7,730 | 9,230 | 3,501 |
| 2010's | 814 | 4,114 | 10,526 | 10,704 | 4,114 | 5,673 | 8,963 | 6,399 | 2,230 | 1,978 |
| 2020's | 2,169 | 2,087 | 3,100 | 6,180 |
| - = No Data Reported; -- = Not Applicable; NA = Not Available; W = Withheld to avoid disclosure of individual company data. |
| Release Date: 8/30/2024 |
| Next Release Date: 8/29/2025 |