|
Download Data (XLS File) |
|
||||||||
|
||||||||
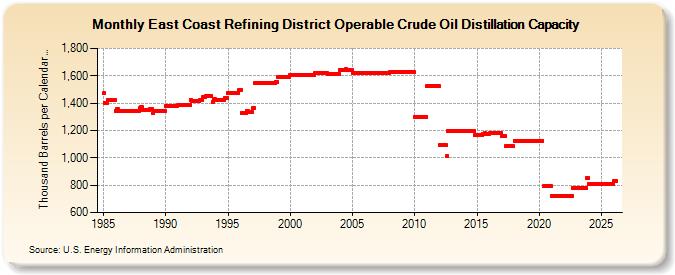
| East Coast Refining District Operable Crude Oil Distillation Capacity (Thousand Barrels per Calendar Day) | ||||||||
| Year | Jan | Feb | Mar | Apr | May | Jun | Jul | Aug | Sep | Oct | Nov | Dec |
|---|---|---|---|---|---|---|---|---|---|---|---|---|
| 1985 | 1,472 | 1,404 | 1,404 | 1,404 | 1,421 | 1,423 | 1,423 | 1,425 | 1,425 | 1,425 | 1,425 | 1,425 |
| 1986 | 1,345 | 1,355 | 1,355 | 1,346 | 1,346 | 1,346 | 1,346 | 1,346 | 1,346 | 1,346 | 1,346 | 1,346 |
| 1987 | 1,341 | 1,341 | 1,341 | 1,341 | 1,341 | 1,341 | 1,341 | 1,341 | 1,341 | 1,341 | 1,341 | 1,361 |
| 1988 | 1,369 | 1,369 | 1,352 | 1,352 | 1,352 | 1,352 | 1,352 | 1,352 | 1,352 | 1,354 | 1,354 | 1,354 |
| 1989 | 1,325 | 1,339 | 1,339 | 1,339 | 1,339 | 1,339 | 1,339 | 1,339 | 1,339 | 1,339 | 1,339 | 1,339 |
| 1990 | 1,381 | 1,381 | 1,381 | 1,381 | 1,381 | 1,381 | 1,381 | 1,381 | 1,381 | 1,381 | 1,381 | 1,381 |
| 1991 | 1,386 | 1,386 | 1,386 | 1,386 | 1,386 | 1,388 | 1,388 | 1,388 | 1,388 | 1,388 | 1,388 | 1,388 |
| 1992 | 1,424 | 1,418 | 1,415 | 1,415 | 1,415 | 1,415 | 1,415 | 1,415 | 1,415 | 1,424 | 1,424 | 1,424 |
| 1993 | 1,442 | 1,442 | 1,442 | 1,452 | 1,452 | 1,452 | 1,452 | 1,452 | 1,452 | 1,410 | 1,433 | 1,433 |
| 1994 | 1,426 | 1,426 | 1,426 | 1,426 | 1,426 | 1,426 | 1,426 | 1,426 | 1,426 | 1,439 | 1,439 | 1,439 |
| 1995 | 1,475 | 1,475 | 1,475 | 1,475 | 1,475 | 1,475 | 1,475 | 1,475 | 1,475 | 1,475 | 1,475 | 1,496 |
| 1996 | 1,498 | 1,326 | 1,326 | 1,326 | 1,326 | 1,326 | 1,341 | 1,341 | 1,337 | 1,337 | 1,337 | 1,337 |
| 1997 | 1,365 | 1,365 | 1,545 | 1,545 | 1,545 | 1,545 | 1,545 | 1,545 | 1,545 | 1,545 | 1,545 | 1,545 |
| 1998 | 1,547 | 1,547 | 1,547 | 1,547 | 1,547 | 1,547 | 1,547 | 1,547 | 1,547 | 1,547 | 1,557 | 1,557 |
| 1999 | 1,591 | 1,591 | 1,591 | 1,591 | 1,591 | 1,591 | 1,591 | 1,591 | 1,591 | 1,591 | 1,591 | 1,591 |
| 2000 | 1,603 | 1,603 | 1,603 | 1,603 | 1,603 | 1,603 | 1,603 | 1,603 | 1,603 | 1,603 | 1,603 | 1,603 |
| 2001 | 1,607 | 1,607 | 1,607 | 1,607 | 1,607 | 1,607 | 1,607 | 1,607 | 1,607 | 1,607 | 1,607 | 1,607 |
| 2002 | 1,621 | 1,621 | 1,621 | 1,621 | 1,621 | 1,621 | 1,621 | 1,621 | 1,621 | 1,621 | 1,621 | 1,621 |
| 2003 | 1,614 | 1,614 | 1,614 | 1,614 | 1,614 | 1,614 | 1,614 | 1,614 | 1,614 | 1,614 | 1,614 | 1,614 |
| 2004 | 1,642 | 1,642 | 1,642 | 1,642 | 1,642 | 1,642 | 1,647 | 1,641 | 1,641 | 1,641 | 1,641 | 1,641 |
| 2005 | 1,623 | 1,623 | 1,623 | 1,623 | 1,623 | 1,623 | 1,623 | 1,623 | 1,623 | 1,623 | 1,623 | 1,623 |
| 2006 | 1,618 | 1,618 | 1,618 | 1,618 | 1,618 | 1,618 | 1,618 | 1,618 | 1,618 | 1,618 | 1,618 | 1,618 |
| 2007 | 1,620 | 1,623 | 1,623 | 1,623 | 1,623 | 1,623 | 1,623 | 1,623 | 1,623 | 1,623 | 1,623 | 1,623 |
| 2008 | 1,627 | 1,627 | 1,627 | 1,627 | 1,627 | 1,627 | 1,627 | 1,627 | 1,627 | 1,627 | 1,627 | 1,627 |
| 2009 | 1,628 | 1,628 | 1,628 | 1,628 | 1,628 | 1,628 | 1,628 | 1,628 | 1,628 | 1,628 | 1,628 | 1,628 |
| 2010 | 1,302 | 1,302 | 1,302 | 1,302 | 1,302 | 1,302 | 1,302 | 1,302 | 1,302 | 1,302 | 1,302 | 1,302 |
| 2011 | 1,523 | 1,523 | 1,523 | 1,523 | 1,523 | 1,523 | 1,523 | 1,523 | 1,523 | 1,523 | 1,523 | 1,523 |
| 2012 | 1,093 | 1,093 | 1,093 | 1,093 | 1,093 | 1,093 | 1,093 | 1,013 | 1,198 | 1,198 | 1,198 | 1,198 |
| 2013 | 1,198 | 1,198 | 1,198 | 1,198 | 1,198 | 1,198 | 1,198 | 1,198 | 1,198 | 1,198 | 1,198 | 1,198 |
| 2014 | 1,198 | 1,198 | 1,198 | 1,198 | 1,198 | 1,198 | 1,198 | 1,198 | 1,198 | 1,198 | 1,170 | 1,170 |
| 2015 | 1,170 | 1,170 | 1,170 | 1,170 | 1,170 | 1,170 | 1,174 | 1,174 | 1,179 | 1,174 | 1,174 | 1,174 |
| 2016 | 1,179 | 1,179 | 1,179 | 1,179 | 1,179 | 1,179 | 1,179 | 1,179 | 1,179 | 1,179 | 1,179 | 1,179 |
| 2017 | 1,157 | 1,157 | 1,157 | 1,157 | 1,083 | 1,083 | 1,083 | 1,083 | 1,083 | 1,083 | 1,083 | 1,083 |
| 2018 | 1,125 | 1,125 | 1,125 | 1,125 | 1,125 | 1,125 | 1,125 | 1,125 | 1,125 | 1,125 | 1,125 | 1,125 |
| 2019 | 1,126 | 1,126 | 1,126 | 1,126 | 1,126 | 1,126 | 1,126 | 1,126 | 1,126 | 1,126 | 1,126 | 1,126 |
| 2020 | 1,126 | 1,126 | 1,126 | 1,126 | 791 | 791 | 791 | 791 | 791 | 791 | 791 | 791 |
| 2021 | 720 | 720 | 720 | 720 | 720 | 720 | 720 | 720 | 720 | 720 | 720 | 720 |
| 2022 | 720 | 720 | 720 | 720 | 720 | 720 | 720 | 720 | 780 | 780 | 780 | 780 |
| 2023 | 780 | 780 | 780 | 780 | 780 | 780 | 780 | 780 | 780 | 780 | 854 | 854 |
| 2024 | 854 | |||||||||||
| - = No Data Reported; -- = Not Applicable; NA = Not Available; W = Withheld to avoid disclosure of individual company data. |
| Release Date: 3/29/2024 |
| Next Release Date: 4/30/2024 |
Referring Pages: