|
Download Data (XLS File) |
|
||||||||
|
||||||||
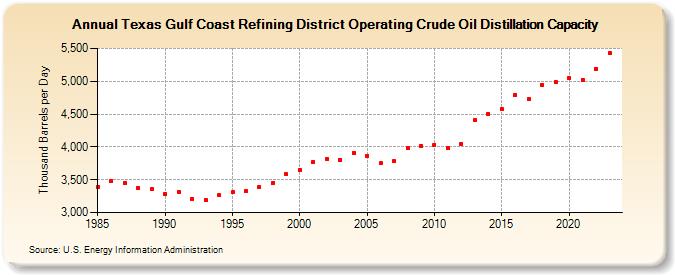
| Texas Gulf Coast Refining District Operating Crude Oil Distillation Capacity (Thousand Barrels per Day) | ||||||||
| Decade | Year-0 | Year-1 | Year-2 | Year-3 | Year-4 | Year-5 | Year-6 | Year-7 | Year-8 | Year-9 |
|---|---|---|---|---|---|---|---|---|---|---|
| 1980's | 3,391 | 3,480 | 3,451 | 3,380 | 3,354 | |||||
| 1990's | 3,285 | 3,319 | 3,210 | 3,196 | 3,260 | 3,306 | 3,327 | 3,391 | 3,453 | 3,583 |
| 2000's | 3,653 | 3,768 | 3,822 | 3,808 | 3,912 | 3,868 | 3,748 | 3,781 | 3,980 | 4,015 |
| 2010's | 4,032 | 3,977 | 4,050 | 4,409 | 4,503 | 4,574 | 4,797 | 4,723 | 4,949 | 4,984 |
| 2020's | 5,051 | 5,023 | 5,191 | 5,426 |
| - = No Data Reported; -- = Not Applicable; NA = Not Available; W = Withheld to avoid disclosure of individual company data. |
| Release Date: 8/30/2024 |
| Next Release Date: 8/29/2025 |