|
Download Data (XLS File) |
|
||||||||
|
||||||||
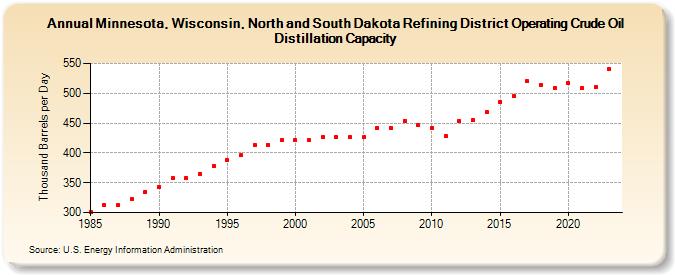
| Minnesota, Wisconsin, North and South Dakota Refining District Operating Crude Oil Distillation Capacity (Thousand Barrels per Day) | ||||||||
| Decade | Year-0 | Year-1 | Year-2 | Year-3 | Year-4 | Year-5 | Year-6 | Year-7 | Year-8 | Year-9 |
|---|---|---|---|---|---|---|---|---|---|---|
| 1980's | 301 | 312 | 312 | 322 | 335 | |||||
| 1990's | 343 | 358 | 358 | 365 | 378 | 388 | 396 | 413 | 414 | 421 |
| 2000's | 421 | 421 | 426 | 426 | 426 | 426 | 442 | 442 | 454 | 447 |
| 2010's | 442 | 428 | 453 | 455 | 468 | 485 | 495 | 520 | 514 | 509 |
| 2020's | 517 | 509 | 510 | 540 |
| - = No Data Reported; -- = Not Applicable; NA = Not Available; W = Withheld to avoid disclosure of individual company data. |
| Release Date: 8/30/2024 |
| Next Release Date: 8/29/2025 |