|
Download Data (XLS File) |
|
||||||||
|
||||||||
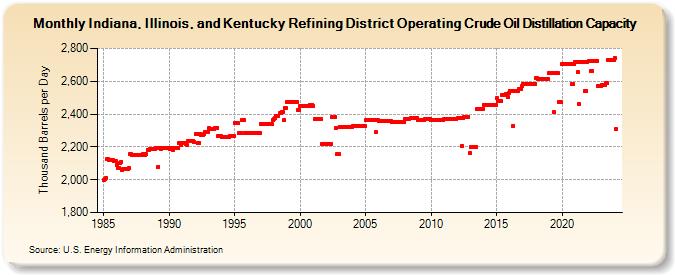
| Indiana, Illinois, and Kentucky Refining District Operating Crude Oil Distillation Capacity (Thousand Barrels per Day) | ||||||||
| Year | Jan | Feb | Mar | Apr | May | Jun | Jul | Aug | Sep | Oct | Nov | Dec |
|---|---|---|---|---|---|---|---|---|---|---|---|---|
| 1985 | 1,997 | 2,003 | 2,010 | 2,129 | 2,124 | 2,122 | 2,122 | 2,121 | 2,122 | 2,112 | 2,115 | 2,112 |
| 1986 | 2,092 | 2,074 | 2,074 | 2,104 | 2,110 | 2,057 | 2,066 | 2,066 | 2,067 | 2,065 | 2,066 | 2,070 |
| 1987 | 2,154 | 2,154 | 2,153 | 2,153 | 2,152 | 2,152 | 2,152 | 2,152 | 2,152 | 2,152 | 2,152 | 2,152 |
| 1988 | 2,158 | 2,157 | 2,153 | 2,154 | 2,184 | 2,183 | 2,187 | 2,187 | 2,187 | 2,187 | 2,187 | 2,187 |
| 1989 | 2,193 | 2,193 | 2,080 | 2,191 | 2,188 | 2,191 | 2,191 | 2,193 | 2,191 | 2,191 | 2,191 | 2,194 |
| 1990 | 2,193 | 2,190 | 2,193 | 2,184 | 2,193 | 2,193 | 2,193 | 2,193 | 2,193 | 2,223 | 2,223 | 2,214 |
| 1991 | 2,221 | 2,221 | 2,221 | 2,218 | 2,209 | 2,236 | 2,236 | 2,236 | 2,236 | 2,236 | 2,236 | 2,227 |
| 1992 | 2,278 | 2,278 | 2,223 | 2,223 | 2,278 | 2,275 | 2,275 | 2,275 | 2,278 | 2,292 | 2,289 | 2,289 |
| 1993 | 2,313 | 2,307 | 2,311 | 2,311 | 2,311 | 2,311 | 2,316 | 2,316 | 2,318 | 2,268 | 2,268 | 2,268 |
| 1994 | 2,258 | 2,261 | 2,261 | 2,261 | 2,261 | 2,261 | 2,261 | 2,261 | 2,266 | 2,266 | 2,264 | 2,266 |
| 1995 | 2,348 | 2,345 | 2,345 | 2,345 | 2,285 | 2,285 | 2,285 | 2,362 | 2,362 | 2,282 | 2,287 | 2,287 |
| 1996 | 2,285 | 2,285 | 2,285 | 2,285 | 2,285 | 2,285 | 2,285 | 2,285 | 2,285 | 2,285 | 2,285 | 2,285 |
| 1997 | 2,339 | 2,339 | 2,339 | 2,339 | 2,339 | 2,339 | 2,339 | 2,339 | 2,339 | 2,339 | 2,339 | 2,364 |
| 1998 | 2,369 | 2,374 | 2,389 | 2,389 | 2,389 | 2,404 | 2,404 | 2,410 | 2,410 | 2,362 | 2,436 | 2,436 |
| 1999 | 2,474 | 2,473 | 2,473 | 2,473 | 2,473 | 2,473 | 2,473 | 2,473 | 2,473 | 2,473 | 2,422 | 2,422 |
| 2000 | 2,450 | 2,450 | 2,447 | 2,447 | 2,447 | 2,447 | 2,447 | 2,447 | 2,447 | 2,457 | 2,457 | 2,457 |
| 2001 | 2,448 | 2,367 | 2,367 | 2,367 | 2,367 | 2,367 | 2,367 | 2,367 | 2,215 | 2,215 | 2,215 | 2,215 |
| 2002 | 2,220 | 2,220 | 2,220 | 2,220 | 2,220 | 2,382 | 2,382 | 2,382 | 2,382 | 2,318 | 2,156 | 2,156 |
| 2003 | 2,324 | 2,324 | 2,324 | 2,324 | 2,324 | 2,324 | 2,324 | 2,324 | 2,324 | 2,324 | 2,324 | 2,324 |
| 2004 | 2,327 | 2,327 | 2,327 | 2,327 | 2,327 | 2,327 | 2,327 | 2,327 | 2,327 | 2,327 | 2,327 | 2,327 |
| 2005 | 2,362 | 2,362 | 2,362 | 2,362 | 2,362 | 2,362 | 2,362 | 2,362 | 2,362 | 2,288 | 2,362 | 2,362 |
| 2006 | 2,355 | 2,355 | 2,355 | 2,355 | 2,355 | 2,355 | 2,355 | 2,355 | 2,355 | 2,355 | 2,355 | 2,355 |
| 2007 | 2,349 | 2,349 | 2,349 | 2,349 | 2,349 | 2,349 | 2,349 | 2,349 | 2,349 | 2,349 | 2,349 | 2,349 |
| 2008 | 2,372 | 2,372 | 2,372 | 2,372 | 2,372 | 2,375 | 2,375 | 2,375 | 2,375 | 2,375 | 2,375 | 2,375 |
| 2009 | 2,365 | 2,365 | 2,365 | 2,365 | 2,365 | 2,365 | 2,370 | 2,370 | 2,370 | 2,370 | 2,370 | 2,370 |
| 2010 | 2,366 | 2,366 | 2,361 | 2,361 | 2,361 | 2,361 | 2,361 | 2,361 | 2,361 | 2,361 | 2,361 | 2,361 |
| 2011 | 2,372 | 2,372 | 2,372 | 2,372 | 2,372 | 2,372 | 2,372 | 2,372 | 2,372 | 2,372 | 2,372 | 2,372 |
| 2012 | 2,373 | 2,373 | 2,373 | 2,373 | 2,206 | 2,373 | 2,381 | 2,381 | 2,381 | 2,381 | 2,381 | 2,164 |
| 2013 | 2,198 | 2,198 | 2,198 | 2,198 | 2,198 | 2,198 | 2,432 | 2,432 | 2,432 | 2,432 | 2,432 | 2,432 |
| 2014 | 2,458 | 2,458 | 2,458 | 2,458 | 2,458 | 2,458 | 2,458 | 2,458 | 2,458 | 2,458 | 2,458 | 2,458 |
| 2015 | 2,496 | 2,478 | 2,478 | 2,478 | 2,478 | 2,517 | 2,517 | 2,517 | 2,522 | 2,522 | 2,502 | 2,529 |
| 2016 | 2,540 | 2,540 | 2,540 | 2,328 | 2,540 | 2,540 | 2,540 | 2,540 | 2,553 | 2,553 | 2,553 | 2,572 |
| 2017 | 2,585 | 2,585 | 2,585 | 2,585 | 2,585 | 2,585 | 2,585 | 2,585 | 2,585 | 2,585 | 2,585 | 2,585 |
| 2018 | 2,618 | 2,618 | 2,613 | 2,613 | 2,613 | 2,613 | 2,613 | 2,613 | 2,613 | 2,613 | 2,613 | 2,613 |
| 2019 | 2,650 | 2,650 | 2,650 | 2,650 | 2,412 | 2,650 | 2,650 | 2,650 | 2,650 | 2,473 | 2,473 | 2,473 |
| 2020 | 2,703 | 2,703 | 2,703 | 2,703 | 2,703 | 2,703 | 2,703 | 2,703 | 2,703 | 2,583 | 2,583 | 2,703 |
| 2021 | 2,716 | 2,716 | 2,656 | 2,464 | 2,716 | 2,716 | 2,717 | 2,718 | 2,718 | 2,539 | 2,539 | 2,718 |
| 2022 | 2,721 | 2,721 | 2,661 | 2,661 | 2,721 | 2,721 | 2,721 | 2,721 | 2,721 | 2,570 | 2,570 | 2,570 |
| 2023 | 2,580 | 2,580 | 2,580 | 2,580 | 2,587 | 2,587 | 2,731 | 2,731 | 2,731 | 2,731 | 2,731 | 2,732 |
| 2024 | 2,741 | |||||||||||
| - = No Data Reported; -- = Not Applicable; NA = Not Available; W = Withheld to avoid disclosure of individual company data. |
| Release Date: 3/29/2024 |
| Next Release Date: 4/30/2024 |