|
Download Data (XLS File) |
|
||||||||
|
||||||||
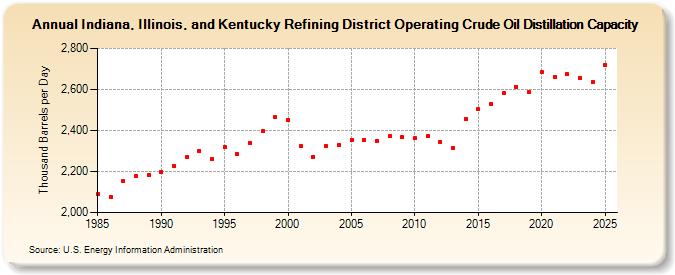
| Indiana, Illinois, and Kentucky Refining District Operating Crude Oil Distillation Capacity (Thousand Barrels per Day) | ||||||||
| Decade | Year-0 | Year-1 | Year-2 | Year-3 | Year-4 | Year-5 | Year-6 | Year-7 | Year-8 | Year-9 |
|---|---|---|---|---|---|---|---|---|---|---|
| 1980's | 2,091 | 2,076 | 2,152 | 2,176 | 2,182 | |||||
| 1990's | 2,199 | 2,228 | 2,271 | 2,301 | 2,262 | 2,318 | 2,285 | 2,341 | 2,397 | 2,464 |
| 2000's | 2,450 | 2,323 | 2,272 | 2,324 | 2,327 | 2,356 | 2,355 | 2,349 | 2,374 | 2,368 |
| 2010's | 2,362 | 2,372 | 2,345 | 2,316 | 2,458 | 2,503 | 2,528 | 2,585 | 2,614 | 2,586 |
| 2020's | 2,683 | 2,661 | 2,673 | 2,657 |
| - = No Data Reported; -- = Not Applicable; NA = Not Available; W = Withheld to avoid disclosure of individual company data. |
| Release Date: 3/29/2024 |
| Next Release Date: 8/30/2024 |