|
Download Data (XLS File) |
|
||||||||
|
||||||||
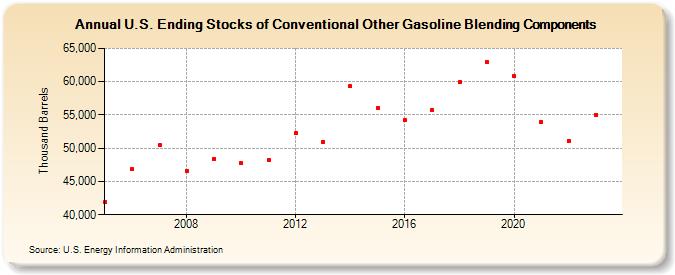
| U.S. Ending Stocks of Conventional Other Gasoline Blending Components (Thousand Barrels) | ||||||||
| Decade | Year-0 | Year-1 | Year-2 | Year-3 | Year-4 | Year-5 | Year-6 | Year-7 | Year-8 | Year-9 |
|---|---|---|---|---|---|---|---|---|---|---|
| 2000's | 41,878 | 46,886 | 50,420 | 46,624 | 48,385 | |||||
| 2010's | 47,699 | 48,276 | 52,247 | 50,933 | 59,316 | 56,064 | 54,169 | 55,739 | 59,913 | 62,977 |
| 2020's | 60,827 | 53,936 | 51,084 | 55,032 |
| - = No Data Reported; -- = Not Applicable; NA = Not Available; W = Withheld to avoid disclosure of individual company data. |
| Release Date: 8/30/2024 |
| Next Release Date: 8/29/2025 |