|
Download Data (XLS File) |
|
||||||||
|
||||||||
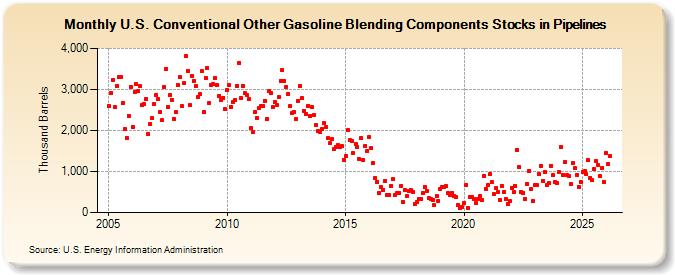
| U.S. Conventional Other Gasoline Blending Components Stocks in Pipelines (Thousand Barrels) | ||||||||
| Year | Jan | Feb | Mar | Apr | May | Jun | Jul | Aug | Sep | Oct | Nov | Dec |
|---|---|---|---|---|---|---|---|---|---|---|---|---|
| 2005 | 2,602 | 2,913 | 3,238 | 2,574 | 3,091 | 3,296 | 3,292 | 2,658 | 2,040 | 1,822 | 2,354 | 3,069 |
| 2006 | 2,084 | 2,938 | 3,121 | 2,956 | 3,080 | 2,615 | 2,638 | 2,770 | 1,908 | 2,154 | 2,296 | 2,638 |
| 2007 | 2,863 | 2,763 | 2,446 | 2,249 | 3,049 | 3,500 | 2,567 | 2,858 | 2,753 | 2,291 | 2,446 | 3,115 |
| 2008 | 3,299 | 2,585 | 3,145 | 3,811 | 3,457 | 2,620 | 3,331 | 3,212 | 3,083 | 2,806 | 2,888 | 3,447 |
| 2009 | 2,438 | 3,282 | 3,531 | 2,673 | 3,114 | 3,122 | 3,281 | 3,101 | 2,841 | 2,738 | 2,803 | 2,514 |
| 2010 | 2,990 | 3,107 | 2,573 | 2,698 | 2,745 | 3,086 | 3,649 | 2,790 | 3,081 | 2,906 | 2,853 | 2,766 |
| 2011 | 2,058 | 1,957 | 2,442 | 2,313 | 2,544 | 2,601 | 2,599 | 2,719 | 2,275 | 2,952 | 2,905 | 2,566 |
| 2012 | 2,682 | 2,611 | 2,807 | 3,210 | 3,473 | 3,211 | 3,059 | 2,891 | 2,590 | 2,436 | 2,456 | 2,281 |
| 2013 | 2,727 | 3,080 | 2,790 | 2,485 | 2,409 | 2,607 | 2,361 | 2,564 | 2,388 | 2,139 | 1,982 | 1,951 |
| 2014 | 2,042 | 2,176 | 2,084 | 1,810 | 1,688 | 1,796 | 1,544 | 1,608 | 1,640 | 1,609 | 1,618 | 1,288 |
| 2015 | 1,373 | 2,002 | 1,758 | 1,750 | 1,445 | 1,662 | 1,602 | 1,298 | 1,817 | 1,284 | 1,629 | 1,505 |
| 2016 | 1,834 | 1,564 | 1,208 | 843 | 750 | 482 | 614 | 558 | 773 | 422 | 438 | 656 |
| 2017 | 810 | 421 | 470 | 483 | 659 | 255 | 539 | 395 | 533 | 556 | 497 | 208 |
| 2018 | 259 | 331 | 336 | 477 | 626 | 528 | 346 | 340 | 306 | 178 | 396 | 282 |
| 2019 | 565 | 634 | 631 | 645 | 468 | 434 | 486 | 399 | 379 | 184 | 110 | 128 |
| 2020 | 237 | 673 | 112 | 383 | 377 | 339 | 223 | 322 | 406 | 304 | 891 | 572 |
| 2021 | 672 | 932 | 744 | 448 | 587 | 507 | 316 | 657 | 499 | 337 | 201 | 273 |
| 2022 | 596 | 498 | 647 | 1,530 | 1,106 | 500 | 475 | 332 | 691 | 1,019 | 577 | 280 |
| 2023 | 673 | 662 | 941 | 1,135 | 773 | 999 | 663 | 726 | 1,143 | 914 | 744 | 719 |
| 2024 | 993 | |||||||||||
| - = No Data Reported; -- = Not Applicable; NA = Not Available; W = Withheld to avoid disclosure of individual company data. |
| Release Date: 3/29/2024 |
| Next Release Date: 4/30/2024 |