|
Download Data (XLS File) |
|
||||||||
|
||||||||
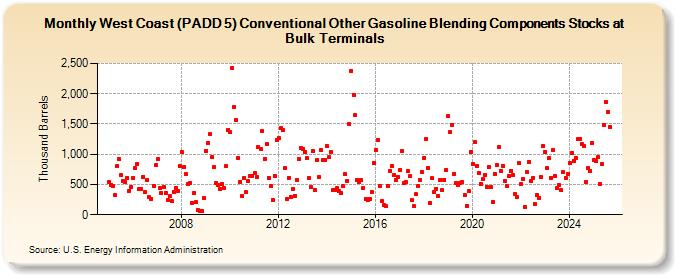
| West Coast (PADD 5) Conventional Other Gasoline Blending Components Stocks at Bulk Terminals (Thousand Barrels) | ||||||||
| Year | Jan | Feb | Mar | Apr | May | Jun | Jul | Aug | Sep | Oct | Nov | Dec |
|---|---|---|---|---|---|---|---|---|---|---|---|---|
| 2005 | 540 | 488 | 475 | 323 | 805 | 914 | 651 | 554 | 544 | 603 | 398 | 466 |
| 2006 | 608 | 768 | 834 | 424 | 427 | 630 | 375 | 568 | 287 | 266 | 482 | 817 |
| 2007 | 913 | 436 | 358 | 462 | 367 | 243 | 306 | 228 | 378 | 443 | 392 | 809 |
| 2008 | 1,030 | 781 | 671 | 511 | 526 | 195 | 364 | 206 | 75 | 54 | 56 | 281 |
| 2009 | 1,059 | 1,190 | 1,330 | 956 | 788 | 524 | 494 | 419 | 512 | 442 | 798 | 1,408 |
| 2010 | 1,362 | 2,425 | 1,785 | 1,564 | 942 | 547 | 311 | 611 | 371 | 556 | 636 | 644 |
| 2011 | 686 | 625 | 1,124 | 1,089 | 1,383 | 920 | 1,164 | 609 | 480 | 248 | 645 | 1,242 |
| 2012 | 1,263 | 1,426 | 1,400 | 764 | 256 | 614 | 296 | 423 | 316 | 576 | 922 | 1,110 |
| 2013 | 1,082 | 1,035 | 936 | 601 | 458 | 1,059 | 416 | 910 | 627 | 1,062 | 904 | 912 |
| 2014 | 1,128 | 951 | 1,031 | 403 | 410 | 438 | 387 | 361 | 468 | 668 | 561 | 1,502 |
| 2015 | 2,383 | 1,985 | 1,647 | 581 | 545 | 566 | 440 | 265 | 238 | 265 | 378 | 855 |
| 2016 | 1,073 | 1,240 | 471 | 221 | 157 | 138 | 477 | 729 | 801 | 649 | 577 | 630 |
| 2017 | 739 | 1,051 | 523 | 538 | 722 | 637 | 242 | 136 | 336 | 479 | 566 | 704 |
| 2018 | 943 | 1,258 | 777 | 197 | 607 | 379 | 430 | 311 | 581 | 403 | 581 | 747 |
| 2019 | 1,627 | 1,363 | 1,484 | 681 | 517 | 484 | 517 | 541 | 318 | 151 | 384 | 1,039 |
| 2020 | 838 | 1,196 | 807 | 690 | 511 | 585 | 662 | 464 | 797 | 453 | 215 | 678 |
| 2021 | 826 | 1,126 | 727 | 809 | 558 | 469 | 635 | 729 | 653 | 344 | 287 | 854 |
| 2022 | 508 | 593 | 132 | 699 | 877 | 562 | 613 | 175 | 323 | 281 | 619 | 1,139 |
| 2023 | 1,042 | 768 | 937 | 610 | 1,068 | 634 | 442 | 486 | 405 | 706 | 612 | 666 |
| 2024 | 859 | |||||||||||
| - = No Data Reported; -- = Not Applicable; NA = Not Available; W = Withheld to avoid disclosure of individual company data. |
| Release Date: 3/29/2024 |
| Next Release Date: 4/30/2024 |