|
Download Data (XLS File) |
|
||||||||
|
||||||||
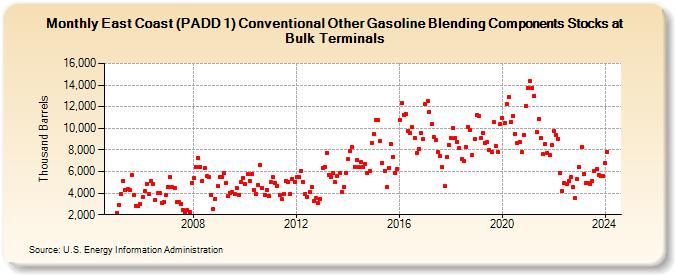
| East Coast (PADD 1) Conventional Other Gasoline Blending Components Stocks at Bulk Terminals (Thousand Barrels) | ||||||||
| Year | Jan | Feb | Mar | Apr | May | Jun | Jul | Aug | Sep | Oct | Nov | Dec |
|---|---|---|---|---|---|---|---|---|---|---|---|---|
| 2005 | 2,203 | 2,898 | 3,933 | 5,160 | 4,249 | 4,379 | 4,288 | 5,669 | 3,871 | 2,846 | 2,793 | 3,021 |
| 2006 | 3,654 | 4,150 | 4,871 | 3,916 | 5,127 | 4,859 | 3,397 | 3,972 | 3,977 | 3,065 | 3,164 | 3,824 |
| 2007 | 4,603 | 5,487 | 4,534 | 4,489 | 3,131 | 3,139 | 3,036 | 2,449 | 2,188 | 2,392 | 2,208 | 4,904 |
| 2008 | 5,393 | 6,372 | 7,286 | 6,421 | 5,156 | 6,322 | 5,589 | 5,472 | 3,870 | 2,535 | 3,498 | 4,643 |
| 2009 | 5,483 | 5,517 | 5,851 | 4,945 | 3,778 | 3,986 | 4,099 | 3,905 | 4,510 | 3,859 | 5,013 | 5,427 |
| 2010 | 4,828 | 5,723 | 5,137 | 5,744 | 4,323 | 3,912 | 4,748 | 6,581 | 4,464 | 3,859 | 4,295 | 3,707 |
| 2011 | 4,995 | 5,449 | 4,954 | 4,669 | 3,785 | 3,409 | 3,939 | 5,125 | 5,026 | 3,924 | 5,339 | 5,061 |
| 2012 | 5,451 | 5,527 | 6,055 | 5,027 | 3,904 | 3,641 | 4,145 | 4,530 | 3,232 | 3,509 | 3,069 | 3,457 |
| 2013 | 6,368 | 6,447 | 7,751 | 5,718 | 5,474 | 5,855 | 4,987 | 5,606 | 5,824 | 4,092 | 4,564 | 5,890 |
| 2014 | 7,127 | 7,881 | 8,276 | 6,434 | 7,020 | 6,439 | 6,901 | 6,424 | 6,674 | 5,816 | 6,013 | 8,627 |
| 2015 | 9,499 | 10,759 | 10,732 | 8,812 | 6,818 | 6,084 | 4,531 | 6,303 | 8,503 | 7,352 | 5,821 | 6,213 |
| 2016 | 10,776 | 12,336 | 11,208 | 11,367 | 9,734 | 9,581 | 10,078 | 9,139 | 7,703 | 8,106 | 9,605 | 8,987 |
| 2017 | 12,235 | 12,508 | 11,537 | 10,370 | 9,238 | 8,887 | 7,778 | 7,451 | 6,397 | 4,612 | 7,339 | 8,498 |
| 2018 | 9,082 | 10,002 | 9,124 | 8,759 | 8,154 | 7,156 | 6,948 | 8,305 | 10,100 | 9,808 | 7,501 | 9,043 |
| 2019 | 11,220 | 11,122 | 9,057 | 9,566 | 8,613 | 8,730 | 7,996 | 7,775 | 10,584 | 8,392 | 7,783 | 10,352 |
| 2020 | 10,999 | 10,462 | 12,265 | 12,918 | 10,613 | 11,115 | 9,496 | 8,597 | 8,762 | 7,771 | 9,425 | 12,105 |
| 2021 | 13,739 | 14,333 | 13,736 | 13,023 | 9,702 | 10,816 | 9,103 | 7,581 | 8,521 | 7,701 | 7,483 | 8,413 |
| 2022 | 9,723 | 9,415 | 9,048 | 5,845 | 4,207 | 4,937 | 4,878 | 5,119 | 5,462 | 4,553 | 3,561 | 5,288 |
| 2023 | 6,422 | 8,312 | 5,751 | 4,891 | 4,979 | 4,852 | 5,157 | 6,058 | 6,242 | 5,676 | 5,584 | 5,595 |
| 2024 | 6,750 | |||||||||||
| - = No Data Reported; -- = Not Applicable; NA = Not Available; W = Withheld to avoid disclosure of individual company data. |
| Release Date: 3/29/2024 |
| Next Release Date: 4/30/2024 |