|
Download Data (XLS File) |
|
||||||||
|
||||||||
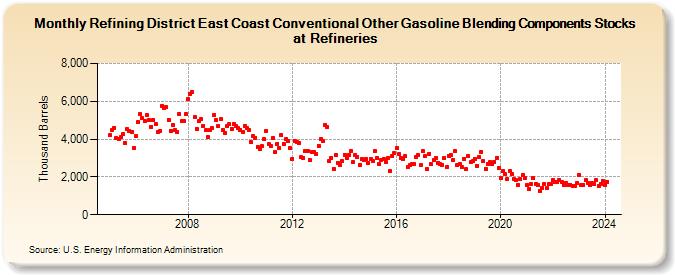
| Refining District East Coast Conventional Other Gasoline Blending Components Stocks at Refineries (Thousand Barrels) | ||||||||
| Year | Jan | Feb | Mar | Apr | May | Jun | Jul | Aug | Sep | Oct | Nov | Dec |
|---|---|---|---|---|---|---|---|---|---|---|---|---|
| 2005 | 4,191 | 4,501 | 4,613 | 4,049 | 4,004 | 4,104 | 4,280 | 3,817 | 4,520 | 4,422 | 4,380 | 3,550 |
| 2006 | 4,143 | 4,902 | 5,319 | 5,091 | 4,977 | 5,264 | 5,003 | 4,660 | 5,012 | 4,797 | 4,385 | 4,438 |
| 2007 | 5,773 | 5,621 | 5,684 | 5,028 | 4,438 | 4,733 | 4,486 | 4,363 | 5,332 | 4,938 | 4,950 | 5,338 |
| 2008 | 6,097 | 6,410 | 6,473 | 5,159 | 4,555 | 4,936 | 5,045 | 4,708 | 4,460 | 4,111 | 4,493 | 4,563 |
| 2009 | 5,299 | 4,985 | 4,681 | 5,047 | 4,496 | 4,338 | 4,670 | 4,775 | 4,548 | 4,796 | 4,667 | 4,572 |
| 2010 | 4,495 | 4,381 | 4,693 | 4,584 | 4,479 | 3,835 | 4,154 | 4,082 | 3,607 | 3,462 | 3,621 | 3,984 |
| 2011 | 4,444 | 3,726 | 3,642 | 4,066 | 3,313 | 3,755 | 3,505 | 4,216 | 3,763 | 3,985 | 3,897 | 3,526 |
| 2012 | 2,967 | 3,911 | 3,822 | 3,812 | 3,033 | 3,008 | 3,347 | 3,357 | 2,902 | 3,332 | 3,306 | 3,213 |
| 2013 | 3,655 | 3,993 | 3,900 | 4,753 | 4,644 | 2,828 | 3,006 | 2,432 | 3,162 | 2,761 | 2,632 | 2,821 |
| 2014 | 3,178 | 3,001 | 3,171 | 3,380 | 2,771 | 3,153 | 3,075 | 2,644 | 2,944 | 2,882 | 2,947 | 2,744 |
| 2015 | 2,935 | 2,832 | 3,379 | 3,015 | 2,666 | 2,906 | 2,959 | 2,807 | 2,981 | 2,308 | 3,109 | 3,247 |
| 2016 | 3,529 | 3,201 | 3,005 | 2,937 | 3,082 | 2,528 | 2,615 | 2,663 | 2,682 | 3,036 | 3,152 | 2,606 |
| 2017 | 3,355 | 3,090 | 2,415 | 3,236 | 2,681 | 2,887 | 2,991 | 2,730 | 2,688 | 2,634 | 3,003 | 2,505 |
| 2018 | 3,124 | 3,147 | 2,900 | 3,361 | 2,608 | 2,702 | 2,501 | 2,965 | 2,410 | 3,082 | 2,768 | 2,816 |
| 2019 | 2,958 | 2,602 | 3,044 | 3,318 | 2,841 | 2,439 | 2,705 | 2,775 | 2,692 | 2,809 | 3,026 | 2,484 |
| 2020 | 1,934 | 2,309 | 2,137 | 1,902 | 2,308 | 2,153 | 1,911 | 1,831 | 1,573 | 1,876 | 2,103 | 1,917 |
| 2021 | 1,577 | 1,368 | 1,618 | 1,937 | 1,636 | 1,561 | 1,272 | 1,424 | 1,633 | 1,387 | 1,602 | 1,632 |
| 2022 | 1,817 | 1,707 | 1,717 | 1,833 | 1,706 | 1,580 | 1,692 | 1,580 | 1,597 | 1,545 | 1,544 | 1,668 |
| 2023 | 2,110 | 1,560 | 1,576 | 1,832 | 1,696 | 1,594 | 1,674 | 1,619 | 1,812 | 1,540 | 1,639 | 1,783 |
| 2024 | 1,596 | 1,755 | 1,608 | 1,431 | 1,575 | 1,298 | ||||||
| - = No Data Reported; -- = Not Applicable; NA = Not Available; W = Withheld to avoid disclosure of individual company data. |
| Release Date: 8/30/2024 |
| Next Release Date: 9/30/2024 |