|
Download Data (XLS File) |
|
||||||||
|
||||||||
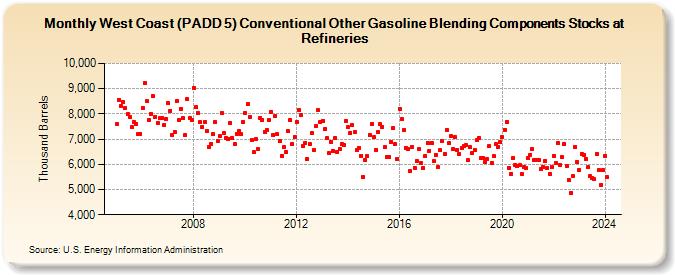
| West Coast (PADD 5) Conventional Other Gasoline Blending Components Stocks at Refineries (Thousand Barrels) | ||||||||
| Year | Jan | Feb | Mar | Apr | May | Jun | Jul | Aug | Sep | Oct | Nov | Dec |
|---|---|---|---|---|---|---|---|---|---|---|---|---|
| 2005 | 7,582 | 8,562 | 8,326 | 8,464 | 8,226 | 7,988 | 7,892 | 7,472 | 7,675 | 7,590 | 7,189 | 7,213 |
| 2006 | 8,232 | 9,223 | 8,505 | 7,744 | 8,001 | 8,692 | 7,890 | 7,653 | 7,823 | 7,839 | 7,575 | 7,807 |
| 2007 | 8,416 | 8,133 | 7,182 | 7,285 | 8,498 | 7,750 | 8,211 | 7,819 | 7,161 | 8,586 | 7,836 | 7,774 |
| 2008 | 9,033 | 8,260 | 8,028 | 7,670 | 7,495 | 7,681 | 7,335 | 6,695 | 6,810 | 7,193 | 7,677 | 6,927 |
| 2009 | 7,120 | 8,043 | 7,257 | 7,059 | 7,015 | 7,642 | 7,035 | 6,788 | 7,217 | 7,331 | 7,184 | 7,663 |
| 2010 | 8,034 | 8,373 | 7,887 | 6,972 | 6,470 | 6,993 | 6,590 | 7,840 | 7,758 | 7,289 | 7,355 | 7,742 |
| 2011 | 8,093 | 7,163 | 7,926 | 7,185 | 6,924 | 6,345 | 6,682 | 6,494 | 7,306 | 7,740 | 6,800 | 7,089 |
| 2012 | 7,681 | 8,159 | 7,960 | 6,730 | 6,850 | 6,204 | 6,807 | 7,226 | 6,570 | 7,500 | 8,141 | 7,683 |
| 2013 | 7,719 | 7,393 | 7,028 | 6,448 | 6,890 | 6,527 | 7,047 | 6,492 | 6,593 | 6,810 | 6,767 | 7,736 |
| 2014 | 7,463 | 7,238 | 7,563 | 7,264 | 6,551 | 6,661 | 6,333 | 5,507 | 6,173 | 6,313 | 7,166 | 7,605 |
| 2015 | 7,068 | 6,585 | 7,273 | 7,583 | 7,493 | 6,667 | 6,300 | 6,299 | 6,897 | 7,432 | 6,786 | 6,192 |
| 2016 | 8,210 | 7,782 | 7,357 | 6,666 | 6,591 | 5,725 | 6,698 | 5,867 | 6,135 | 6,588 | 6,042 | 5,857 |
| 2017 | 6,315 | 6,839 | 6,538 | 6,847 | 6,114 | 6,376 | 5,882 | 6,557 | 6,933 | 6,399 | 7,359 | 6,830 |
| 2018 | 7,105 | 6,596 | 7,065 | 6,583 | 6,406 | 6,647 | 6,722 | 6,765 | 6,159 | 6,674 | 6,443 | 6,584 |
| 2019 | 6,948 | 7,063 | 6,242 | 6,258 | 6,086 | 6,206 | 6,708 | 6,052 | 6,313 | 6,792 | 6,697 | 6,875 |
| 2020 | 7,075 | 7,371 | 7,697 | 5,873 | 5,626 | 6,246 | 5,957 | 5,926 | 5,957 | 5,617 | 5,893 | 5,845 |
| 2021 | 6,254 | 6,387 | 6,611 | 6,153 | 6,171 | 6,168 | 5,833 | 5,888 | 6,137 | 5,846 | 5,627 | 5,894 |
| 2022 | 6,345 | 6,047 | 6,860 | 5,986 | 6,273 | 6,802 | 5,952 | 5,388 | 4,880 | 5,526 | 6,693 | 6,087 |
| 2023 | 5,791 | 6,427 | 6,360 | 6,216 | 5,878 | 5,523 | 5,464 | 5,411 | 6,402 | 5,760 | 5,183 | 5,768 |
| 2024 | 6,343 | |||||||||||
| - = No Data Reported; -- = Not Applicable; NA = Not Available; W = Withheld to avoid disclosure of individual company data. |
| Release Date: 3/29/2024 |
| Next Release Date: 4/30/2024 |