|
Download Data (XLS File) |
|
||||||||
|
||||||||
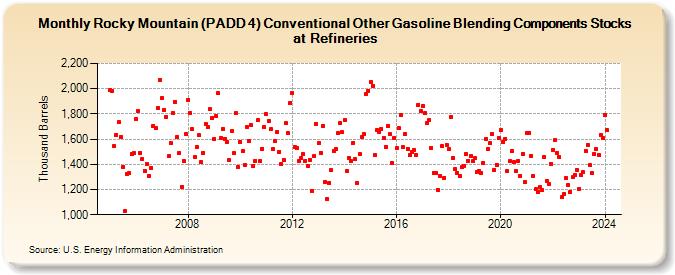
| Rocky Mountain (PADD 4) Conventional Other Gasoline Blending Components Stocks at Refineries (Thousand Barrels) | ||||||||
| Year | Jan | Feb | Mar | Apr | May | Jun | Jul | Aug | Sep | Oct | Nov | Dec |
|---|---|---|---|---|---|---|---|---|---|---|---|---|
| 2005 | 1,988 | 1,983 | 1,547 | 1,634 | 1,733 | 1,619 | 1,382 | 1,030 | 1,327 | 1,328 | 1,482 | 1,488 |
| 2006 | 1,759 | 1,823 | 1,492 | 1,441 | 1,349 | 1,404 | 1,311 | 1,373 | 1,707 | 1,686 | 1,848 | 2,069 |
| 2007 | 1,926 | 1,829 | 1,779 | 1,462 | 1,566 | 1,806 | 1,898 | 1,617 | 1,491 | 1,222 | 1,426 | 1,639 |
| 2008 | 1,914 | 1,808 | 1,679 | 1,457 | 1,540 | 1,629 | 1,418 | 1,492 | 1,719 | 1,693 | 1,835 | 1,770 |
| 2009 | 1,599 | 1,784 | 1,962 | 1,606 | 1,684 | 1,603 | 1,574 | 1,431 | 1,666 | 1,486 | 1,807 | 1,375 |
| 2010 | 1,580 | 1,503 | 1,396 | 1,698 | 1,581 | 1,711 | 1,387 | 1,430 | 1,749 | 1,425 | 1,524 | 1,693 |
| 2011 | 1,798 | 1,744 | 1,678 | 1,521 | 1,584 | 1,656 | 1,501 | 1,401 | 1,438 | 1,724 | 1,648 | 1,888 |
| 2012 | 1,965 | 1,541 | 1,528 | 1,426 | 1,451 | 1,483 | 1,430 | 1,390 | 1,436 | 1,190 | 1,463 | 1,723 |
| 2013 | 1,569 | 1,490 | 1,707 | 1,260 | 1,126 | 1,254 | 1,352 | 1,509 | 1,525 | 1,646 | 1,725 | 1,654 |
| 2014 | 1,752 | 1,350 | 1,451 | 1,425 | 1,569 | 1,439 | 1,255 | 1,478 | 1,613 | 1,639 | 1,960 | 1,985 |
| 2015 | 2,052 | 2,024 | 1,470 | 1,670 | 1,660 | 1,681 | 1,612 | 1,541 | 1,705 | 1,637 | 1,411 | 1,609 |
| 2016 | 1,528 | 1,685 | 1,788 | 1,537 | 1,640 | 1,525 | 1,473 | 1,494 | 1,513 | 1,472 | 1,874 | 1,823 |
| 2017 | 1,866 | 1,805 | 1,728 | 1,751 | 1,530 | 1,331 | 1,332 | 1,200 | 1,309 | 1,545 | 1,295 | 1,556 |
| 2018 | 1,521 | 1,779 | 1,451 | 1,359 | 1,331 | 1,305 | 1,380 | 1,390 | 1,479 | 1,429 | 1,467 | 1,424 |
| 2019 | 1,447 | 1,342 | 1,345 | 1,328 | 1,414 | 1,599 | 1,522 | 1,567 | 1,643 | 1,358 | 1,397 | 1,608 |
| 2020 | 1,671 | 1,575 | 1,602 | 1,345 | 1,423 | 1,505 | 1,415 | 1,344 | 1,428 | 1,307 | 1,484 | 1,259 |
| 2021 | 1,646 | 1,650 | 1,464 | 1,308 | 1,202 | 1,179 | 1,217 | 1,195 | 1,459 | 1,268 | 1,245 | 1,405 |
| 2022 | 1,516 | 1,590 | 1,490 | 1,457 | 1,137 | 1,166 | 1,292 | 1,232 | 1,182 | 1,297 | 1,312 | 1,356 |
| 2023 | 1,206 | 1,314 | 1,335 | 1,507 | 1,557 | 1,394 | 1,334 | 1,481 | 1,520 | 1,476 | 1,634 | 1,607 |
| 2024 | 1,794 | |||||||||||
| - = No Data Reported; -- = Not Applicable; NA = Not Available; W = Withheld to avoid disclosure of individual company data. |
| Release Date: 3/29/2024 |
| Next Release Date: 4/30/2024 |