|
Download Data (XLS File) |
|
||||||||
|
||||||||
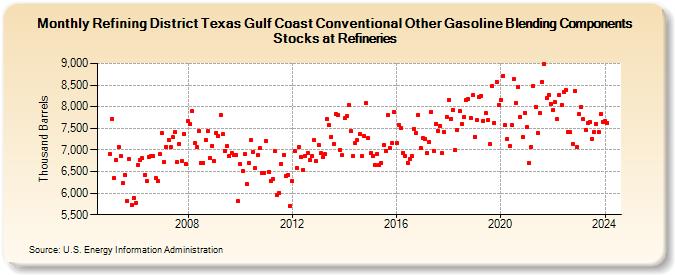
| Refining District Texas Gulf Coast Conventional Other Gasoline Blending Components Stocks at Refineries (Thousand Barrels) | ||||||||
| Year | Jan | Feb | Mar | Apr | May | Jun | Jul | Aug | Sep | Oct | Nov | Dec |
|---|---|---|---|---|---|---|---|---|---|---|---|---|
| 2005 | 6,902 | 7,720 | 6,360 | 6,776 | 7,078 | 6,864 | 6,228 | 6,426 | 5,826 | 6,779 | 5,728 | 5,896 |
| 2006 | 5,776 | 6,653 | 6,777 | 6,804 | 6,427 | 6,274 | 6,840 | 6,854 | 6,860 | 6,348 | 6,270 | 6,902 |
| 2007 | 7,381 | 6,715 | 7,078 | 7,231 | 7,057 | 7,289 | 7,424 | 6,712 | 7,146 | 6,744 | 7,368 | 6,681 |
| 2008 | 7,668 | 7,589 | 7,889 | 7,149 | 7,068 | 7,426 | 6,702 | 6,699 | 7,238 | 7,429 | 6,824 | 7,087 |
| 2009 | 6,736 | 7,402 | 7,333 | 7,815 | 7,362 | 6,978 | 7,083 | 6,852 | 6,936 | 6,876 | 6,875 | 5,817 |
| 2010 | 6,670 | 6,513 | 6,894 | 6,208 | 6,704 | 7,225 | 6,959 | 6,576 | 6,878 | 7,037 | 6,473 | 6,458 |
| 2011 | 7,211 | 6,494 | 6,276 | 6,323 | 6,963 | 5,964 | 6,012 | 6,674 | 6,893 | 6,387 | 6,422 | 5,710 |
| 2012 | 6,283 | 6,964 | 6,582 | 7,059 | 6,829 | 6,543 | 6,862 | 6,933 | 6,764 | 6,852 | 7,240 | 6,739 |
| 2013 | 7,123 | 6,922 | 6,829 | 6,897 | 7,717 | 7,576 | 7,307 | 7,146 | 7,834 | 7,809 | 7,009 | 6,873 |
| 2014 | 7,727 | 7,786 | 8,035 | 7,430 | 6,848 | 7,155 | 7,227 | 7,365 | 6,848 | 7,319 | 8,077 | 7,271 |
| 2015 | 6,918 | 6,851 | 6,639 | 6,908 | 6,642 | 6,704 | 7,110 | 6,981 | 7,798 | 7,041 | 7,165 | 7,888 |
| 2016 | 7,162 | 7,580 | 7,513 | 6,929 | 6,861 | 6,708 | 6,794 | 6,860 | 7,485 | 7,396 | 7,809 | 7,052 |
| 2017 | 7,272 | 7,253 | 6,918 | 7,194 | 7,888 | 6,985 | 7,608 | 7,444 | 7,563 | 6,926 | 7,411 | 7,767 |
| 2018 | 8,157 | 7,723 | 7,913 | 6,994 | 7,463 | 7,905 | 7,600 | 7,771 | 8,157 | 8,169 | 7,738 | 8,263 |
| 2019 | 7,307 | 7,701 | 8,215 | 8,255 | 7,678 | 7,845 | 7,684 | 7,129 | 8,472 | 7,633 | 8,581 | 8,044 |
| 2020 | 8,164 | 8,718 | 7,566 | 7,256 | 7,092 | 7,575 | 8,637 | 8,087 | 8,451 | 7,764 | 7,293 | 7,865 |
| 2021 | 7,525 | 6,701 | 7,071 | 8,485 | 8,004 | 7,401 | 7,844 | 8,582 | 8,984 | 8,196 | 8,270 | 8,073 |
| 2022 | 7,931 | 8,101 | 7,709 | 8,269 | 8,043 | 8,336 | 8,376 | 7,423 | 7,404 | 7,145 | 8,373 | 7,066 |
| 2023 | 7,823 | 8,001 | 7,708 | 7,467 | 7,626 | 7,636 | 7,253 | 7,404 | 7,599 | 7,415 | 7,826 | 7,655 |
| 2024 | 7,670 | |||||||||||
| - = No Data Reported; -- = Not Applicable; NA = Not Available; W = Withheld to avoid disclosure of individual company data. |
| Release Date: 3/29/2024 |
| Next Release Date: 4/30/2024 |