|
Download Data (XLS File) |
|
||||||||
|
||||||||
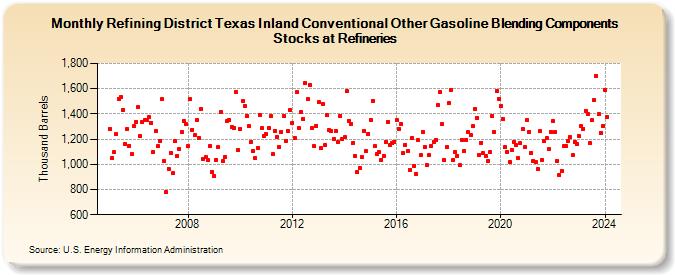
| Refining District Texas Inland Conventional Other Gasoline Blending Components Stocks at Refineries (Thousand Barrels) | ||||||||
| Year | Jan | Feb | Mar | Apr | May | Jun | Jul | Aug | Sep | Oct | Nov | Dec |
|---|---|---|---|---|---|---|---|---|---|---|---|---|
| 2005 | 1,283 | 1,047 | 1,095 | 1,238 | 1,521 | 1,533 | 1,431 | 1,165 | 1,282 | 1,149 | 1,078 | 1,300 |
| 2006 | 1,339 | 1,452 | 1,223 | 1,333 | 1,350 | 1,350 | 1,374 | 1,330 | 1,098 | 1,266 | 1,142 | 1,185 |
| 2007 | 1,517 | 1,025 | 781 | 964 | 1,091 | 928 | 1,182 | 1,062 | 1,121 | 1,256 | 1,347 | 1,316 |
| 2008 | 1,145 | 1,516 | 1,276 | 1,229 | 1,348 | 1,211 | 1,437 | 1,042 | 1,055 | 1,036 | 1,147 | 935 |
| 2009 | 907 | 1,037 | 1,135 | 1,416 | 1,023 | 1,056 | 1,345 | 1,352 | 1,295 | 1,287 | 1,570 | 1,112 |
| 2010 | 1,279 | 1,502 | 1,462 | 1,387 | 1,300 | 1,176 | 1,106 | 1,049 | 1,133 | 1,390 | 1,288 | 1,227 |
| 2011 | 1,241 | 1,288 | 1,380 | 1,079 | 1,267 | 1,215 | 1,136 | 1,260 | 1,385 | 1,187 | 1,263 | 1,430 |
| 2012 | 1,328 | 1,211 | 1,571 | 1,291 | 1,416 | 1,362 | 1,645 | 1,516 | 1,633 | 1,288 | 1,143 | 1,307 |
| 2013 | 1,492 | 1,127 | 1,481 | 1,153 | 1,391 | 1,271 | 1,264 | 1,204 | 1,263 | 1,174 | 1,386 | 1,200 |
| 2014 | 1,214 | 1,579 | 1,345 | 1,321 | 1,166 | 1,069 | 936 | 971 | 1,058 | 1,267 | 1,102 | 1,243 |
| 2015 | 1,354 | 1,506 | 1,143 | 1,083 | 1,094 | 1,038 | 1,066 | 1,180 | 1,337 | 1,151 | 1,167 | 1,180 |
| 2016 | 1,348 | 1,284 | 1,321 | 1,089 | 1,152 | 1,105 | 957 | 1,208 | 988 | 924 | 1,190 | 1,072 |
| 2017 | 1,255 | 1,138 | 995 | 1,072 | 1,147 | 1,178 | 1,192 | 1,468 | 1,574 | 1,317 | 1,034 | 1,137 |
| 2018 | 1,485 | 1,593 | 1,033 | 1,097 | 1,068 | 993 | 1,195 | 1,105 | 1,193 | 1,254 | 1,236 | 1,301 |
| 2019 | 1,440 | 1,369 | 1,076 | 1,173 | 1,089 | 1,069 | 1,026 | 1,094 | 1,385 | 1,258 | 1,581 | 1,521 |
| 2020 | 1,463 | 1,359 | 1,135 | 1,099 | 1,019 | 1,116 | 1,178 | 1,153 | 1,047 | 1,167 | 1,279 | 1,135 |
| 2021 | 1,352 | 1,260 | 1,092 | 1,026 | 1,018 | 963 | 1,263 | 1,036 | 1,184 | 1,209 | 1,119 | 1,257 |
| 2022 | 1,343 | 1,254 | 1,025 | 916 | 946 | 1,142 | 1,142 | 1,181 | 1,215 | 1,072 | 1,177 | 1,159 |
| 2023 | 1,224 | 1,303 | 1,285 | 1,425 | 1,397 | 1,168 | 1,348 | 1,510 | 1,700 | 1,397 | 1,252 | 1,303 |
| 2024 | 1,591 | 1,375 | 1,537 | 1,364 | 1,336 | 1,445 | ||||||
| - = No Data Reported; -- = Not Applicable; NA = Not Available; W = Withheld to avoid disclosure of individual company data. |
| Release Date: 8/30/2024 |
| Next Release Date: 9/30/2024 |