|
Download Data (XLS File) |
|
||||||||
|
||||||||
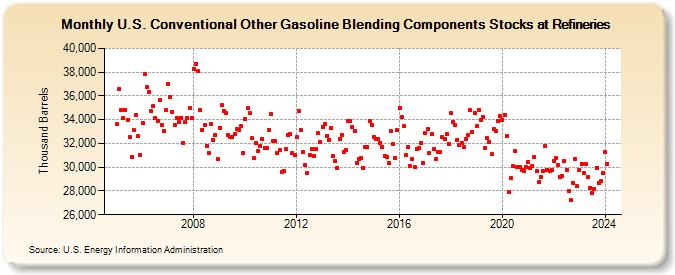
| U.S. Conventional Other Gasoline Blending Components Stocks at Refineries (Thousand Barrels) | ||||||||
| Year | Jan | Feb | Mar | Apr | May | Jun | Jul | Aug | Sep | Oct | Nov | Dec |
|---|---|---|---|---|---|---|---|---|---|---|---|---|
| 2005 | 33,629 | 36,576 | 34,821 | 34,111 | 34,856 | 33,968 | 32,576 | 30,882 | 33,147 | 34,382 | 32,622 | 31,048 |
| 2006 | 33,713 | 37,875 | 36,718 | 36,292 | 34,689 | 35,157 | 34,137 | 33,891 | 35,630 | 33,537 | 33,080 | 34,819 |
| 2007 | 36,982 | 35,950 | 34,687 | 33,570 | 34,148 | 33,778 | 34,157 | 32,053 | 33,780 | 34,156 | 34,944 | 34,154 |
| 2008 | 38,270 | 38,708 | 38,071 | 34,788 | 33,160 | 33,554 | 31,810 | 31,190 | 33,625 | 32,327 | 32,746 | 30,717 |
| 2009 | 33,322 | 35,254 | 34,761 | 34,576 | 32,671 | 32,513 | 32,505 | 32,764 | 33,202 | 33,135 | 33,466 | 31,220 |
| 2010 | 34,041 | 34,978 | 34,544 | 32,417 | 30,766 | 32,064 | 31,332 | 31,817 | 32,404 | 31,631 | 31,604 | 33,135 |
| 2011 | 34,439 | 32,226 | 32,242 | 31,180 | 31,487 | 29,606 | 29,661 | 31,572 | 32,670 | 32,782 | 31,181 | 30,996 |
| 2012 | 32,518 | 34,733 | 33,124 | 31,262 | 30,226 | 29,502 | 30,993 | 31,520 | 30,972 | 31,559 | 32,851 | 32,081 |
| 2013 | 33,420 | 33,641 | 32,629 | 32,261 | 33,286 | 30,944 | 30,509 | 29,945 | 32,352 | 32,717 | 31,303 | 31,479 |
| 2014 | 33,850 | 33,870 | 33,380 | 33,041 | 30,362 | 30,704 | 30,739 | 29,956 | 31,708 | 31,732 | 33,906 | 33,580 |
| 2015 | 32,571 | 32,397 | 32,377 | 32,064 | 31,705 | 30,953 | 30,861 | 30,347 | 33,063 | 31,940 | 30,815 | 33,092 |
| 2016 | 34,982 | 34,241 | 33,444 | 31,011 | 31,667 | 30,068 | 30,667 | 30,007 | 31,532 | 31,645 | 32,039 | 30,344 |
| 2017 | 32,859 | 33,194 | 31,173 | 32,778 | 31,542 | 30,675 | 31,298 | 31,242 | 32,529 | 32,364 | 32,812 | 31,993 |
| 2018 | 34,537 | 33,802 | 33,518 | 32,320 | 31,838 | 32,066 | 31,687 | 32,352 | 32,702 | 34,778 | 32,997 | 34,574 |
| 2019 | 33,445 | 34,832 | 33,978 | 34,266 | 31,656 | 32,439 | 32,089 | 31,086 | 33,197 | 33,062 | 33,894 | 34,298 |
| 2020 | 33,960 | 34,356 | 32,647 | 27,917 | 29,050 | 30,062 | 31,355 | 30,002 | 30,058 | 29,785 | 29,709 | 30,045 |
| 2021 | 30,468 | 29,946 | 30,122 | 30,828 | 29,679 | 28,734 | 29,196 | 29,667 | 31,809 | 29,795 | 29,689 | 29,733 |
| 2022 | 30,520 | 30,797 | 30,163 | 29,183 | 29,256 | 30,510 | 29,787 | 28,013 | 27,213 | 28,665 | 30,730 | 28,378 |
| 2023 | 29,771 | 30,208 | 29,549 | 30,250 | 29,155 | 28,318 | 27,835 | 28,187 | 29,956 | 28,675 | 28,961 | 29,501 |
| 2024 | 31,293 | 30,310 | 30,152 | 30,100 | 29,837 | 28,649 | ||||||
| - = No Data Reported; -- = Not Applicable; NA = Not Available; W = Withheld to avoid disclosure of individual company data. |
| Release Date: 8/30/2024 |
| Next Release Date: 9/30/2024 |