|
Download Data (XLS File) |
|
||||||||
|
||||||||
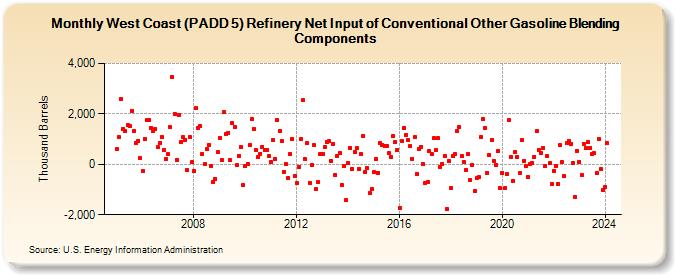
| West Coast (PADD 5) Refinery Net Input of Conventional Other Gasoline Blending Components (Thousand Barrels) | ||||||||
| Year | Jan | Feb | Mar | Apr | May | Jun | Jul | Aug | Sep | Oct | Nov | Dec |
|---|---|---|---|---|---|---|---|---|---|---|---|---|
| 2005 | 589 | 1,083 | 2,605 | 1,402 | 1,326 | 1,540 | 1,503 | 2,132 | 1,330 | 862 | 936 | 234 |
| 2006 | -261 | 1,015 | 1,740 | 1,773 | 1,460 | 1,313 | 1,406 | 680 | 843 | 1,085 | 586 | 222 |
| 2007 | 391 | 1,469 | 3,469 | 2,000 | 185 | 1,948 | 898 | 1,068 | 981 | -235 | 1,071 | 73 |
| 2008 | -270 | 2,246 | 1,454 | 1,500 | 406 | 7 | 591 | 767 | -65 | -690 | -574 | 480 |
| 2009 | 1,037 | 154 | 2,059 | 1,208 | 1,246 | 158 | 1,619 | 1,484 | -22 | 335 | 680 | -814 |
| 2010 | -61 | 5 | 771 | 1,789 | 1,408 | 585 | 299 | 420 | 705 | 558 | 569 | 312 |
| 2011 | 88 | 952 | 221 | 1,742 | 1,316 | 919 | -291 | 4 | -535 | 415 | 1,002 | -471 |
| 2012 | -757 | -97 | 997 | 2,535 | 200 | 826 | -726 | -21 | 755 | -981 | -700 | 413 |
| 2013 | 408 | 706 | 875 | 906 | 150 | 824 | -418 | 336 | 453 | -819 | -52 | -1,436 |
| 2014 | 57 | 645 | -175 | 487 | 635 | -184 | 393 | 1,117 | -313 | -166 | -1,145 | -988 |
| 2015 | -323 | 209 | -327 | 835 | 782 | 733 | 725 | 431 | 273 | 1,105 | 881 | 578 |
| 2016 | -1,740 | 921 | 1,447 | 1,182 | 967 | 714 | 222 | 1,065 | -377 | 606 | 697 | -1 |
| 2017 | -747 | -703 | 516 | 401 | 1,027 | 554 | 1,031 | -97 | 26 | 326 | -1,763 | 134 |
| 2018 | -949 | 324 | 395 | 1,314 | 1,476 | 330 | 94 | -207 | 395 | -612 | -24 | -1,073 |
| 2019 | -546 | -515 | 1,075 | 1,792 | 1,447 | -327 | 358 | 964 | 137 | -35 | 511 | -956 |
| 2020 | -344 | -952 | -398 | 1,752 | 282 | -657 | 469 | 298 | -354 | 963 | 146 | -48 |
| 2021 | -487 | -1 | 58 | 302 | 1,302 | 565 | 452 | 653 | -69 | 324 | 37 | -793 |
| 2022 | -264 | -57 | -765 | 750 | 76 | -469 | 828 | 943 | 814 | 53 | -1,304 | 527 |
| 2023 | 103 | -418 | 819 | 633 | 877 | 663 | 422 | 430 | -340 | 1,020 | -188 | -1,023 |
| 2024 | -893 | |||||||||||
| - = No Data Reported; -- = Not Applicable; NA = Not Available; W = Withheld to avoid disclosure of individual company data. |
| Release Date: 3/29/2024 |
| Next Release Date: 4/30/2024 |