|
Download Data (XLS File) |
|
||||||||
|
||||||||
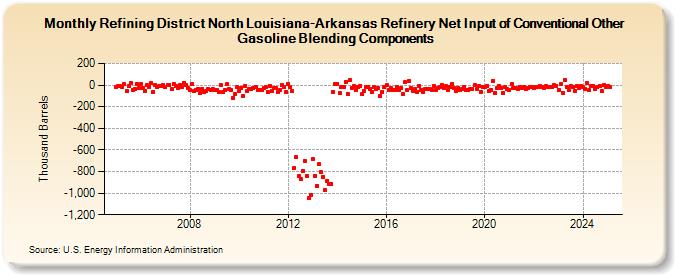
| Refining District North Louisiana-Arkansas Refinery Net Input of Conventional Other Gasoline Blending Components (Thousand Barrels) | ||||||||
| Year | Jan | Feb | Mar | Apr | May | Jun | Jul | Aug | Sep | Oct | Nov | Dec |
|---|---|---|---|---|---|---|---|---|---|---|---|---|
| 2005 | -20 | -4 | -11 | -20 | 10 | -55 | -13 | 17 | -43 | -34 | 12 | -30 |
| 2006 | 9 | -26 | -51 | 1 | -17 | 19 | -63 | 0 | -20 | -5 | -12 | 2 |
| 2007 | -14 | -1 | 3 | -38 | 8 | -12 | -23 | 0 | -21 | 23 | 2 | -28 |
| 2008 | -48 | 11 | -58 | -46 | -33 | -71 | -35 | -63 | -53 | -38 | -44 | -33 |
| 2009 | -42 | -46 | -62 | -2 | -63 | -44 | 7 | -36 | -45 | -118 | -78 | -19 |
| 2010 | -53 | -28 | -101 | -11 | -59 | -40 | -34 | -30 | -16 | -41 | -46 | -42 |
| 2011 | -29 | -22 | -60 | -4 | -57 | -27 | -25 | -64 | -42 | 0 | -16 | -61 |
| 2012 | 11 | -20 | -58 | -766 | -666 | -844 | -872 | -792 | -699 | -846 | -1,049 | -1,015 |
| 2013 | -684 | -837 | -931 | -735 | -802 | -847 | -970 | -885 | -913 | -916 | -64 | 13 |
| 2014 | 14 | -74 | -16 | -15 | 33 | -78 | 49 | -29 | -12 | -46 | -20 | -4 |
| 2015 | -86 | -58 | -14 | -15 | -38 | -64 | -21 | -34 | -29 | -99 | -62 | -21 |
| 2016 | -3 | -47 | -31 | -41 | -50 | -17 | -43 | -31 | -85 | 25 | -48 | 41 |
| 2017 | -31 | -51 | -34 | -60 | -4 | -43 | -66 | -39 | -34 | -34 | -47 | -10 |
| 2018 | -48 | -30 | -16 | 3 | -28 | -11 | -47 | -19 | 9 | -27 | -52 | -29 |
| 2019 | -44 | -32 | -14 | -44 | -42 | -36 | -35 | -3 | -39 | -13 | -64 | -16 |
| 2020 | -19 | -8 | -59 | -45 | 41 | -77 | -23 | -8 | -24 | -71 | -15 | -39 |
| 2021 | -47 | 11 | -23 | -29 | -33 | -17 | -27 | -17 | -40 | -23 | -15 | -21 |
| 2022 | -26 | -15 | -16 | -10 | -14 | -31 | -11 | -22 | -20 | -18 | -2 | -6 |
| 2023 | -43 | 7 | -70 | 46 | -21 | -45 | -9 | -17 | -53 | -13 | -28 | -13 |
| 2024 | -21 | -33 | ||||||||||
| - = No Data Reported; -- = Not Applicable; NA = Not Available; W = Withheld to avoid disclosure of individual company data. |
| Release Date: 4/30/2024 |
| Next Release Date: 5/31/2024 |