|
Download Data (XLS File) |
|
||||||||
|
||||||||
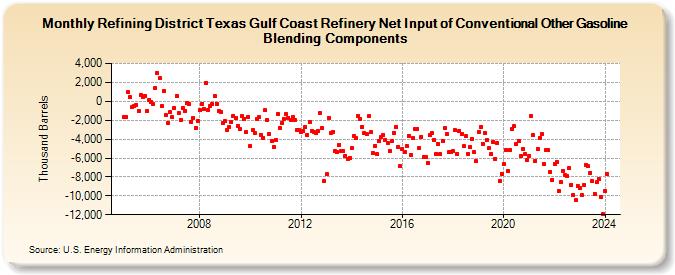
| Refining District Texas Gulf Coast Refinery Net Input of Conventional Other Gasoline Blending Components (Thousand Barrels) | ||||||||
| Year | Jan | Feb | Mar | Apr | May | Jun | Jul | Aug | Sep | Oct | Nov | Dec |
|---|---|---|---|---|---|---|---|---|---|---|---|---|
| 2005 | -1,684 | -1,652 | 941 | 428 | -557 | -488 | -386 | -1,048 | 648 | 482 | 563 | -977 |
| 2006 | 182 | -60 | -254 | 1,426 | 2,969 | 2,421 | -481 | 1,103 | -1,455 | -2,282 | -1,158 | -1,701 |
| 2007 | -734 | 584 | -1,220 | -1,954 | -732 | -997 | -198 | -263 | -2,180 | -1,738 | -2,819 | -2,050 |
| 2008 | -960 | -241 | -769 | 1,938 | -873 | -492 | -299 | 555 | -234 | -1,000 | -1,087 | -2,289 |
| 2009 | -2,096 | -3,063 | -2,699 | -2,214 | -1,515 | -1,807 | -2,608 | -2,928 | -1,519 | -1,845 | -3,288 | -1,635 |
| 2010 | -4,705 | -3,047 | -3,312 | -1,855 | -1,696 | -3,521 | -3,845 | -958 | -1,968 | -3,425 | -4,210 | -4,814 |
| 2011 | -4,127 | -1,328 | -2,810 | -2,260 | -1,900 | -1,352 | -1,715 | -1,937 | -1,650 | -2,006 | -3,020 | -3,081 |
| 2012 | -3,218 | -3,182 | -2,733 | -3,544 | -2,207 | -3,111 | -3,222 | -3,360 | -3,192 | -1,223 | -2,818 | -8,424 |
| 2013 | -7,728 | -1,731 | -3,373 | -3,217 | -5,292 | -5,414 | -4,581 | -5,299 | -5,284 | -5,753 | -6,088 | -5,970 |
| 2014 | -4,955 | -3,652 | -3,916 | -1,513 | -1,861 | -2,668 | -3,346 | -3,428 | -1,592 | -3,233 | -5,496 | -4,720 |
| 2015 | -5,606 | -4,211 | -3,781 | -3,551 | -4,134 | -4,407 | -5,234 | -4,254 | -3,325 | -2,712 | -4,808 | -6,879 |
| 2016 | -5,035 | -5,373 | -4,732 | -3,624 | -5,650 | -3,919 | -2,917 | -2,892 | -4,921 | -3,728 | -5,873 | -5,845 |
| 2017 | -6,487 | -3,608 | -3,352 | -4,066 | -5,546 | -4,468 | -5,594 | -4,176 | -2,850 | -3,452 | -5,399 | -5,330 |
| 2018 | -5,283 | -3,076 | -5,534 | -3,103 | -3,472 | -4,769 | -3,721 | -5,595 | -4,856 | -3,964 | -5,380 | -6,367 |
| 2019 | -3,275 | -2,710 | -4,480 | -3,335 | -4,098 | -4,988 | -5,594 | -4,273 | -6,080 | -4,439 | -8,455 | -7,690 |
| 2020 | -6,685 | -5,144 | -7,355 | -5,137 | -2,886 | -2,661 | -4,481 | -4,184 | -5,777 | -4,995 | -5,539 | -6,174 |
| 2021 | -5,755 | -1,607 | -3,600 | -6,276 | -5,065 | -3,869 | -3,485 | -6,652 | -5,135 | -5,152 | -7,480 | -8,293 |
| 2022 | -6,610 | -6,397 | -9,453 | -8,584 | -7,330 | -7,821 | -7,897 | -7,083 | -8,823 | -9,926 | -10,472 | -8,923 |
| 2023 | -9,171 | -9,966 | -8,880 | -6,728 | -6,897 | -7,576 | -8,482 | -9,769 | -8,579 | -8,243 | -10,079 | -11,948 |
| 2024 | -9,506 | |||||||||||
| - = No Data Reported; -- = Not Applicable; NA = Not Available; W = Withheld to avoid disclosure of individual company data. |
| Release Date: 3/29/2024 |
| Next Release Date: 4/30/2024 |