|
Download Data (XLS File) |
|
||||||||
|
||||||||
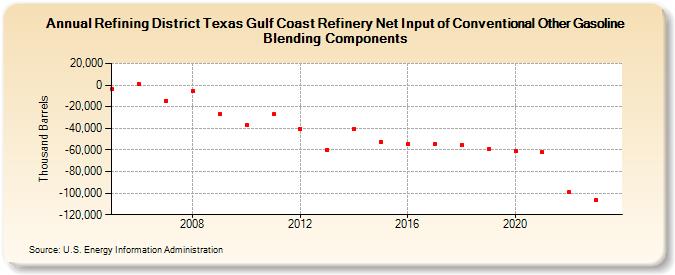
| Refining District Texas Gulf Coast Refinery Net Input of Conventional Other Gasoline Blending Components (Thousand Barrels) | ||||||||
| Decade | Year-0 | Year-1 | Year-2 | Year-3 | Year-4 | Year-5 | Year-6 | Year-7 | Year-8 | Year-9 |
|---|---|---|---|---|---|---|---|---|---|---|
| 2000's | -3,730 | 710 | -14,301 | -5,751 | -27,217 | |||||
| 2010's | -37,356 | -27,186 | -40,234 | -59,730 | -40,380 | -52,902 | -54,509 | -54,328 | -55,120 | -59,417 |
| 2020's | -61,018 | -62,369 | -99,319 | -106,318 |
| - = No Data Reported; -- = Not Applicable; NA = Not Available; W = Withheld to avoid disclosure of individual company data. |
| Release Date: 4/30/2024 |
| Next Release Date: 8/30/2024 |